July 2026 Overview

Interactive County Charts
Visualize year-over-year real estate statistics for specific counties, such as active listings, new listings, pending sales, closed sales, and months of inventory.
Active Listings
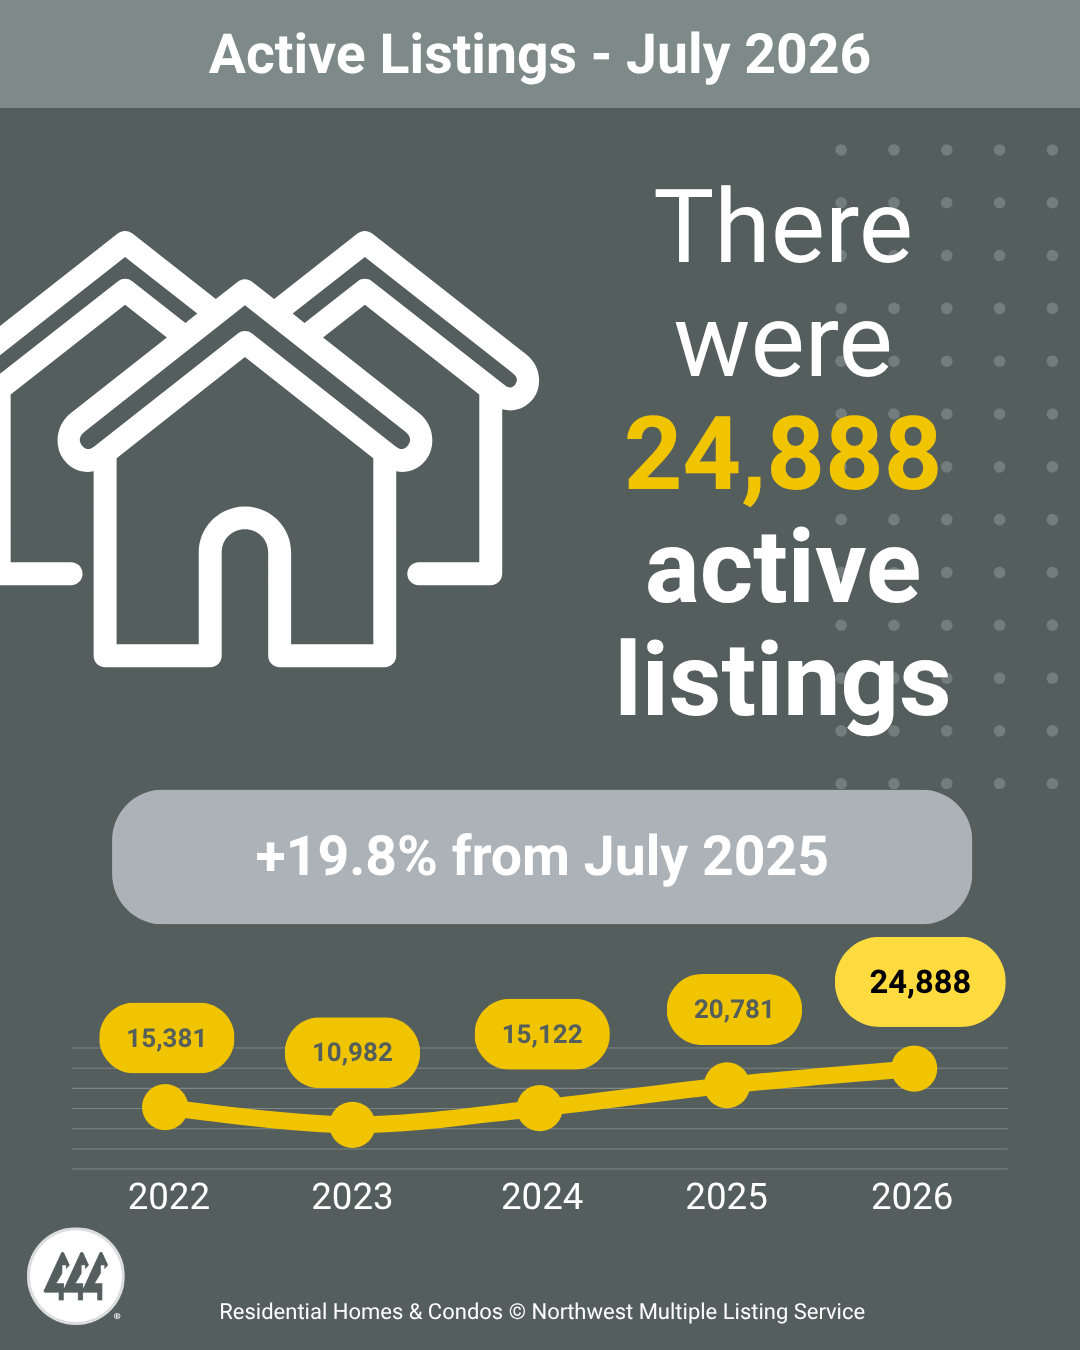
The total number of properties listed for sale increased 19.8% year over year, with 24,888 active listings on the market at the end of July 2026, compared to 20,781 at the end of July 2025.
Buyers had access to more than 4,100 additional homes compared to a year ago, continuing a trend of expanding inventory across the Northwest MLS service area.
Twenty-five of the 27 NWMLS counties experienced year-over-year inventory growth. The five counties with the largest increases were Okanogan (+48.0%), Snohomish (+34.7%), Walla Walla (+28.1%), Thurston (+27.5%), and King (+23.7%).
New Listings
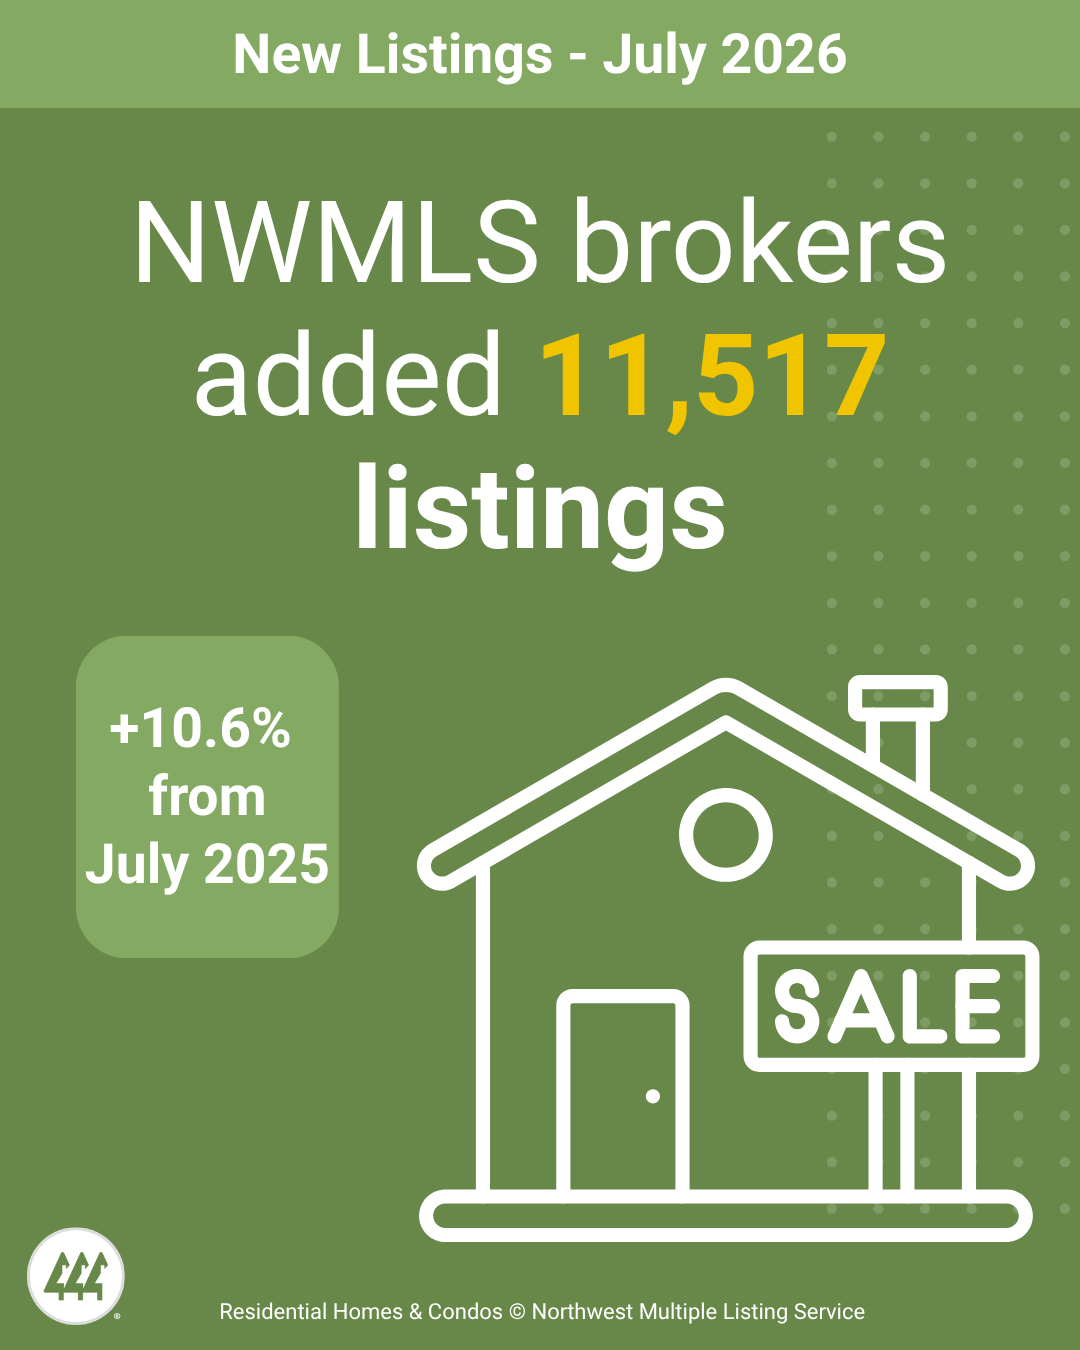
NWMLS brokers added 11,517 new listings to the database in July 2026. That represented a year-over-year increase of 10.5% compared to July 2025, when 10,418 listings were added to the NWMLS database.
Sellers brought nearly 1,100 more homes to market than they did a year ago, giving buyers more options across the Northwest MLS service area.
Pending Sales
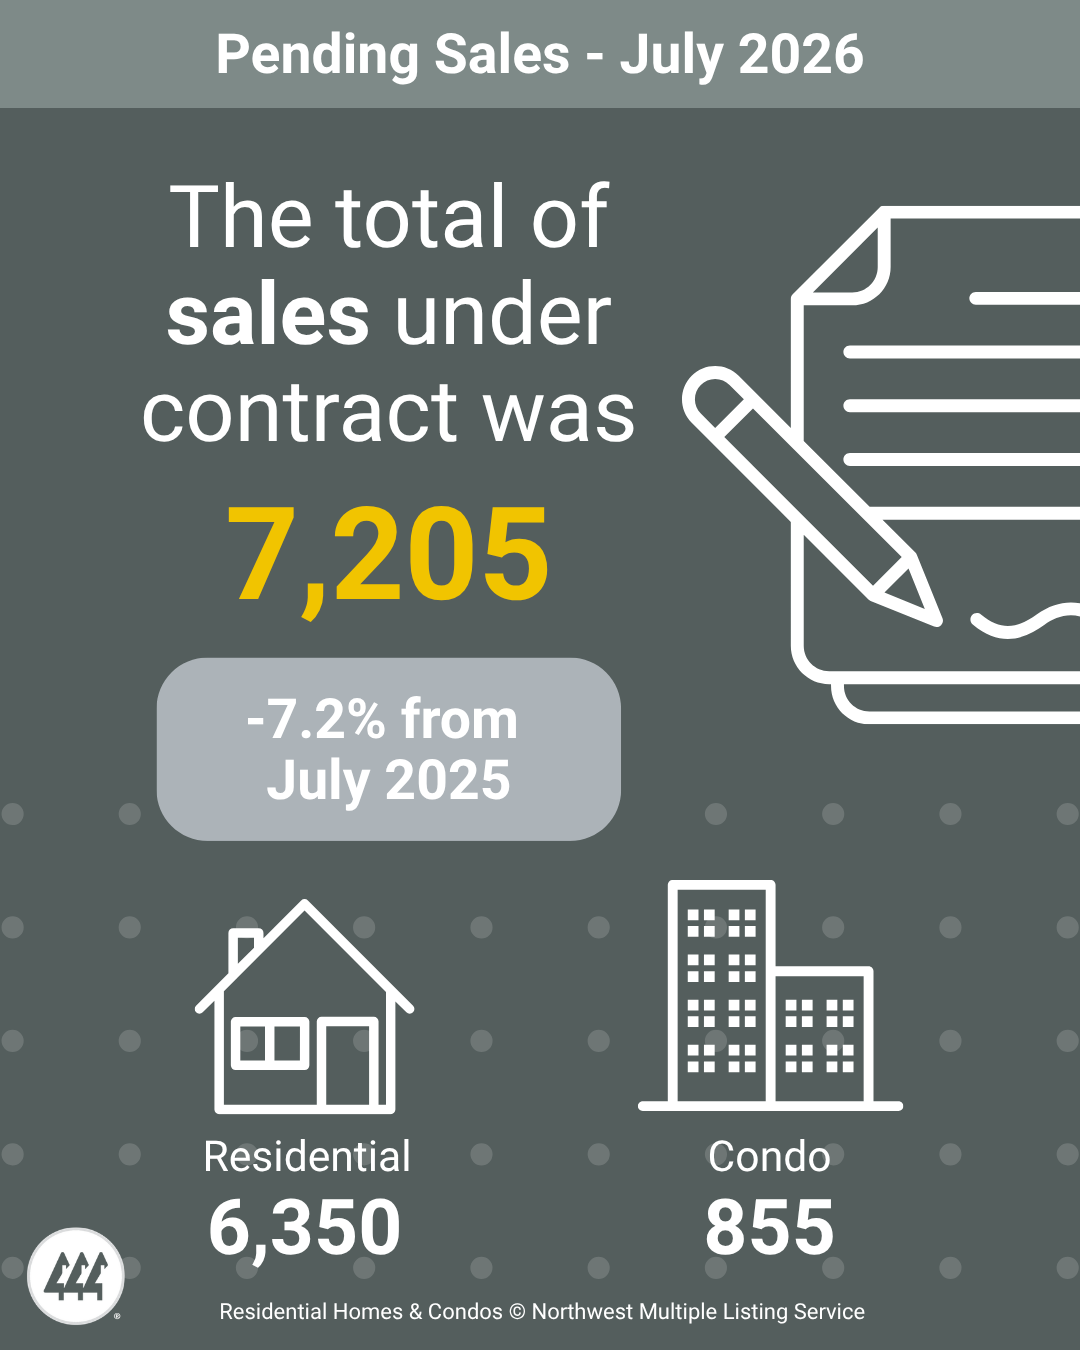
There were 7,205 residential and condominium units under contract in July 2026, a 7.2% decrease compared to July 2025, when 7,764 listings were under contract.
Closed Sales
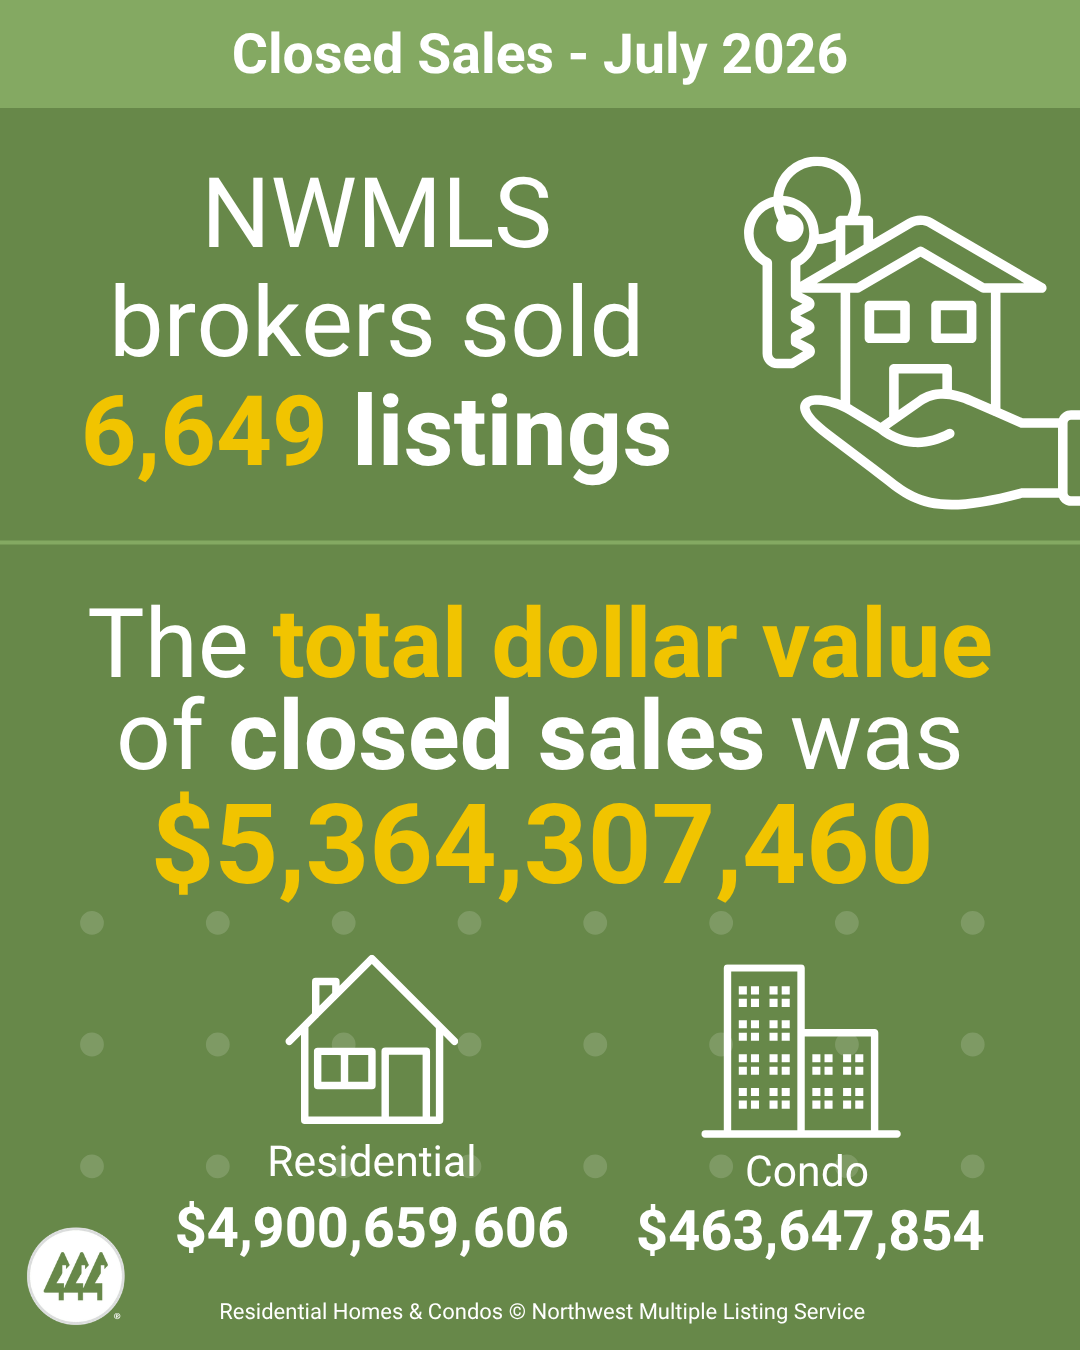
Closed sales decreased 3.2% year over year, with 6,649 residential and condominium transactions completed in July 2026, compared to 6,867 in July 2025. Of the 6,649 closed sales in July 2026, 5,866 were residential home sales and 783 were condominium sales.
The total dollar value of closed sales in July 2026 was $4.90 billion for residential homes and $463.6 million for condominiums, for a combined total of $5.36 billion.
Although closed sales were lower than in July 2025, transactions continued throughout the Northwest MLS service area as the supply of available properties expanded. More homes were available for sale than a year ago as inventory continued to increase.
Months of Inventory
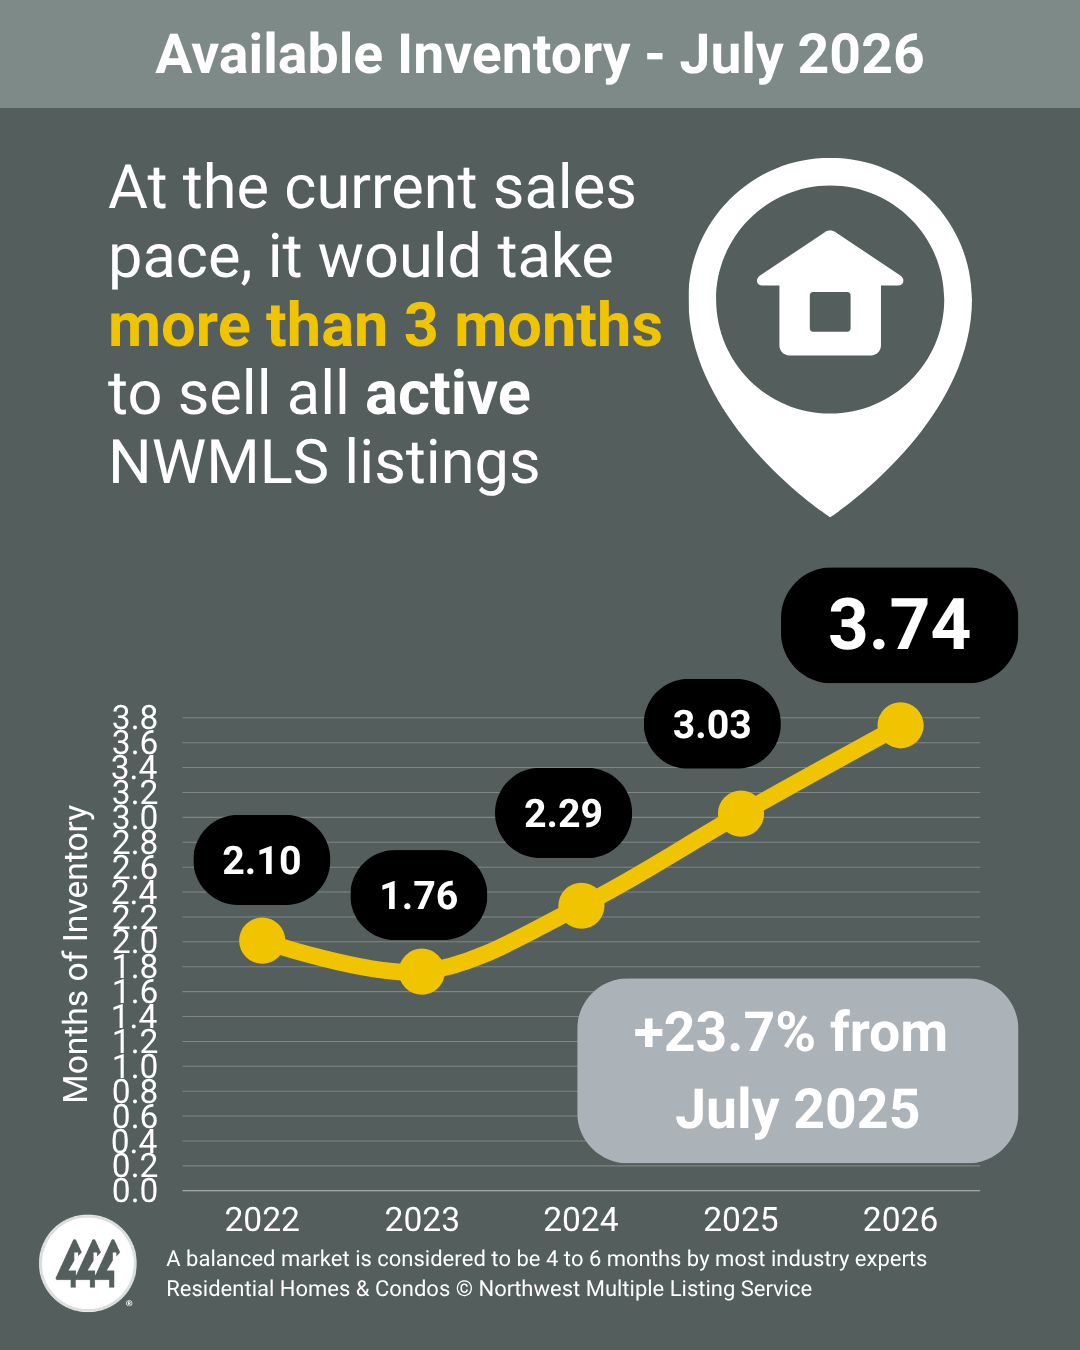
A balanced market is generally considered to have four to six months of inventory. At the July 2026 pace of sales, it would take approximately 3.74 months to sell every home currently listed in the NWMLS service area.
The counties with the lowest months of inventory were Kitsap (2.28), Snohomish (3.01), Pierce (3.04), Thurston (3.11), and Clallam (3.23), indicating tighter market conditions in those areas.
Although the overall NWMLS service area remained below balanced market conditions, buyers had substantially more homes to choose from than they did in July 2025. The continued increase in the number of homes for sale resulted in more inventory being available than a year ago.
Median Price
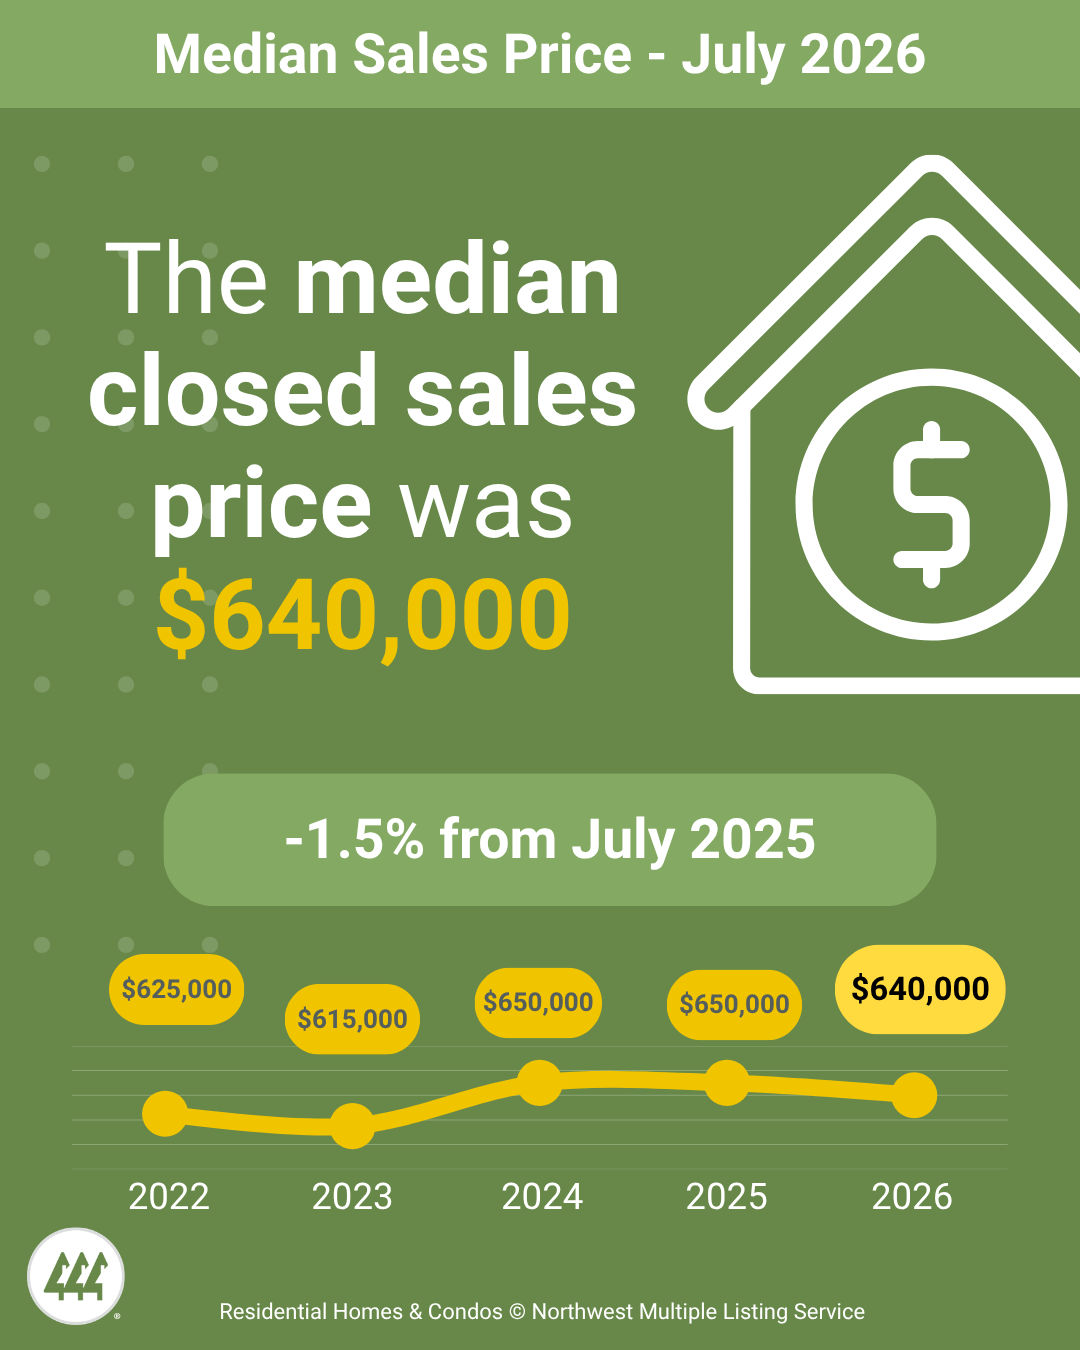
The median sales price for residential homes and condominiums sold in July 2026 was $640,000, a 1.5% decrease compared to July 2025 ($650,000).
Despite continued inventory growth throughout the region, the median sales price declined only slightly compared to July 2025. Increased inventory and slightly lower median prices reflect continued changes in market conditions across the Northwest MLS service area.
The counties with the highest median sales prices were San Juan ($880,000), King ($879,500), and Snohomish ($719,000), while the lowest median prices were recorded in Ferry ($199,900), Columbia ($240,000), and Okanogan ($321,500).
San Juan County had the highest median sales price in the NWMLS service area at $880,000, more than 4.4 times higher than Ferry County’s median price of $199,900, highlighting the significant variation in housing prices across Washington.
View Individual County Comprehensive & Breakout Reports in PDF Format

Historical Charts
Get granular on real estate statistics with interactive 5-year charts encompassing the length of active, new, and additional metrics.
Usage Terms
You may share and republish NWMLS’s Market Snapshot Video, interactive charts, and infographics on websites, blogs, and social media. Any use of NWMLS’s statistical charts or infographics must include the logo that is displayed on the graphics and the following attribution: “Information and statistics compiled and reported by the Northwest Multiple Listing Service.” You may not alter or otherwise modify NWMLS’s Market Snapshot Video, interactive charts, and infographics. Derivatives of NWMLS’s housing marketing statistics may not be published, broadcast, rewritten or redistributed without prior written permission.