October 2023 Overview
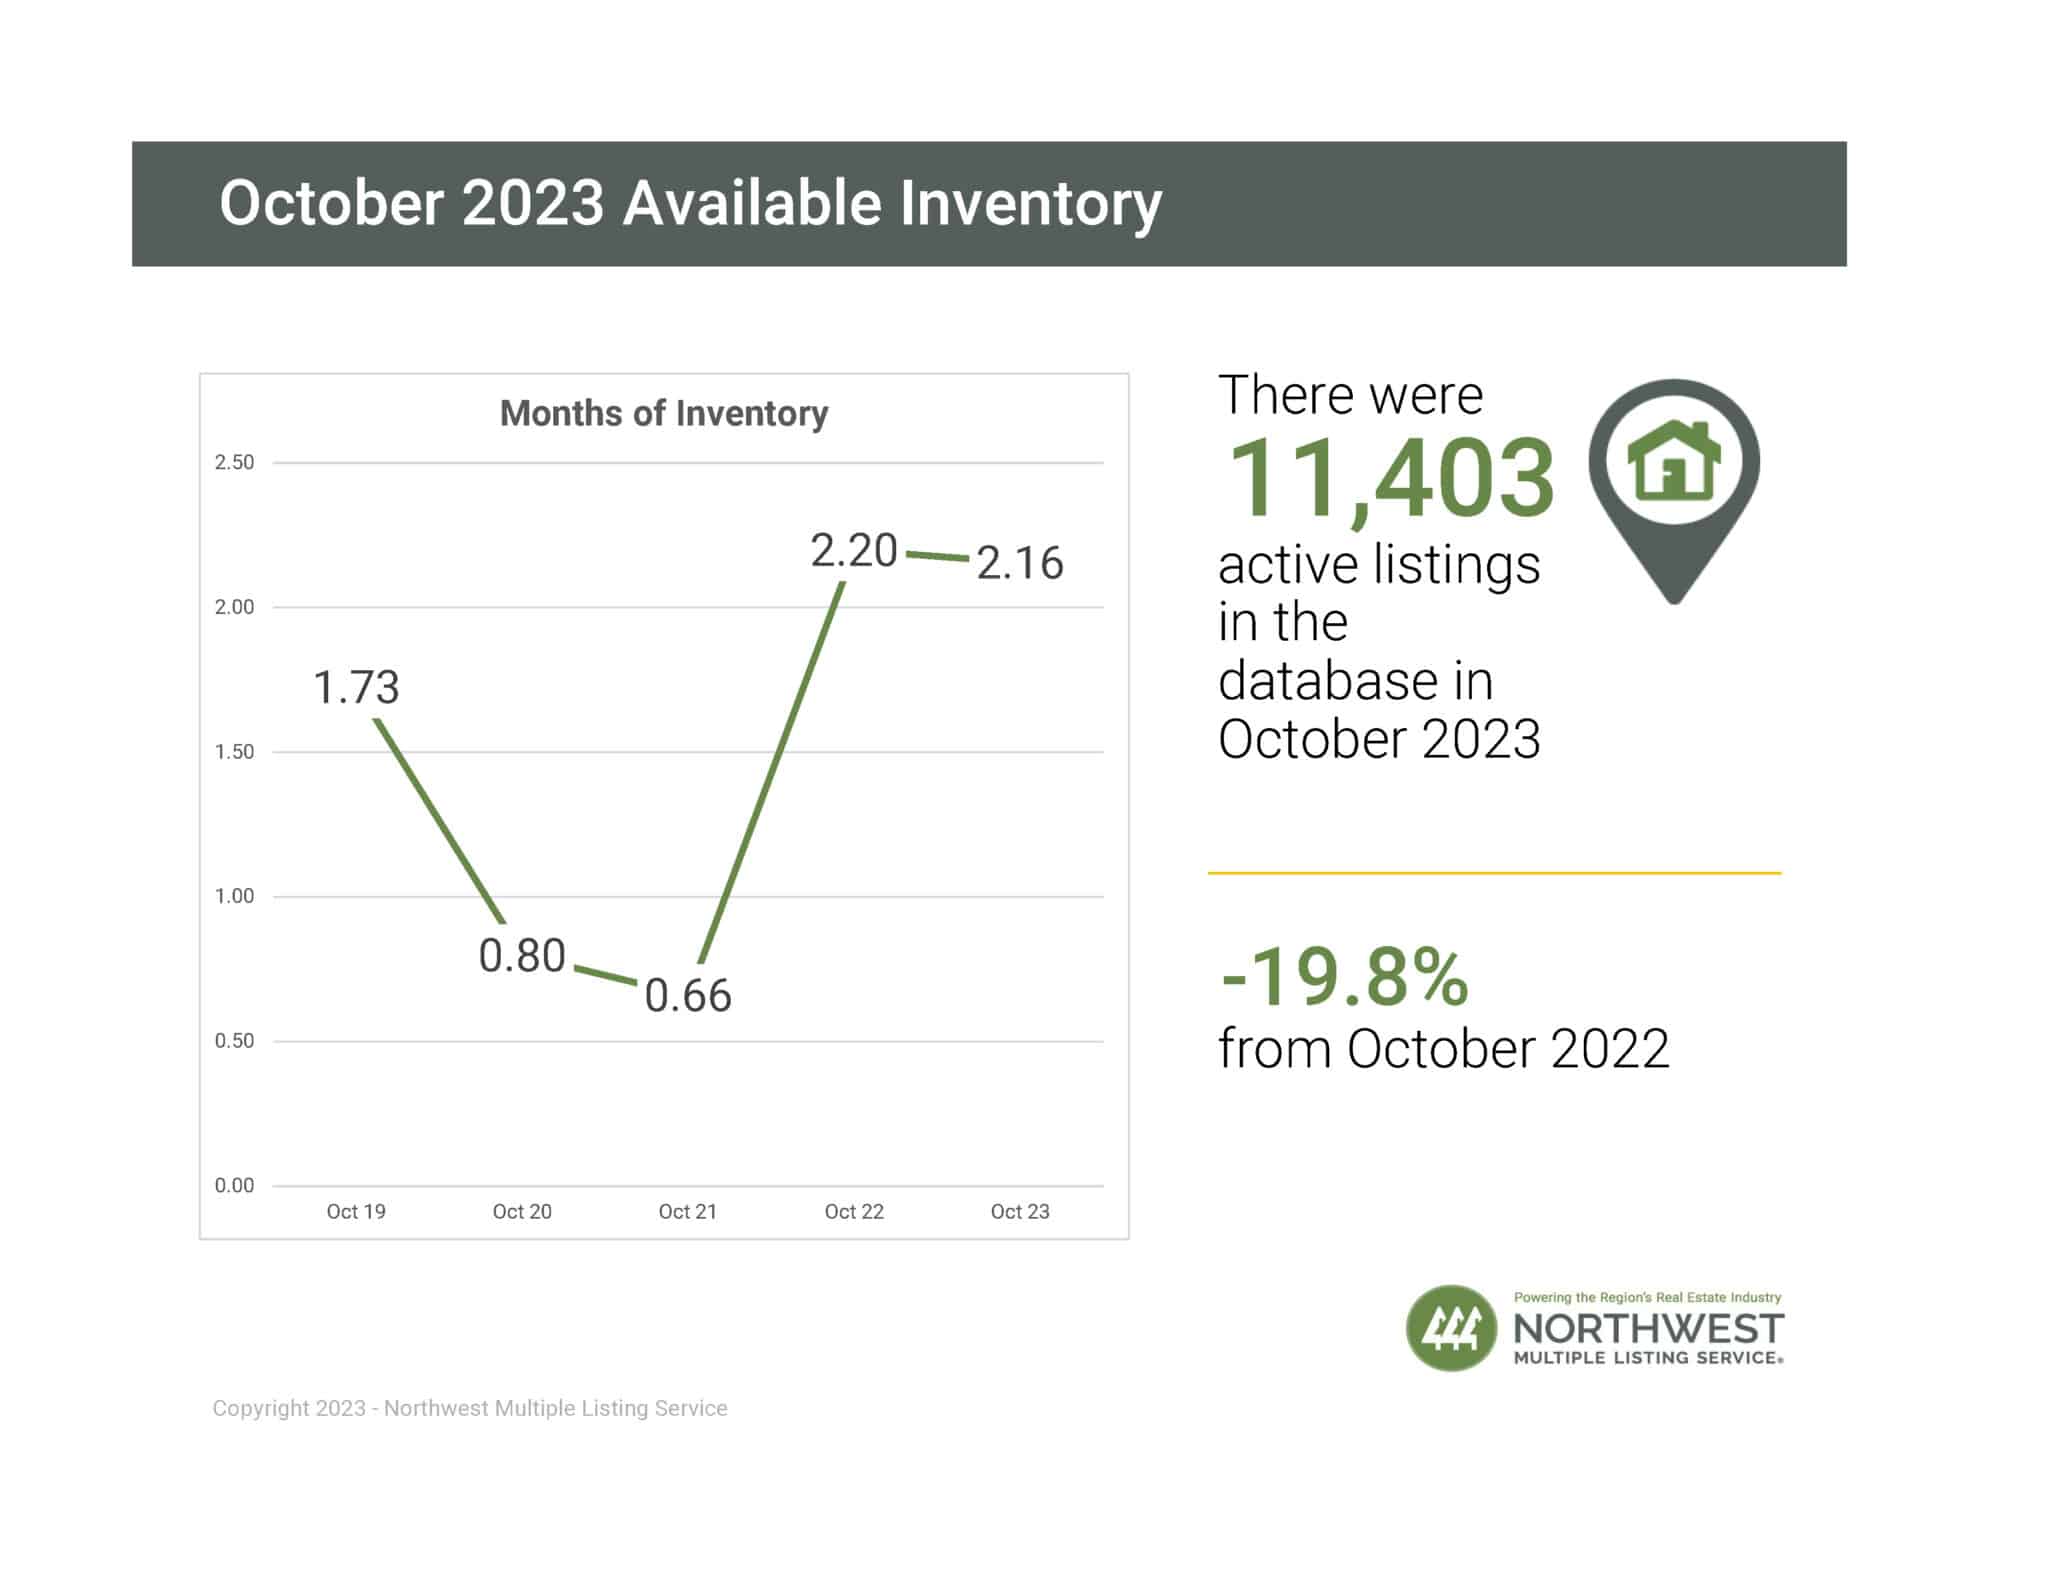
Active Listings
There were 11,403 active listings in the database for this month.
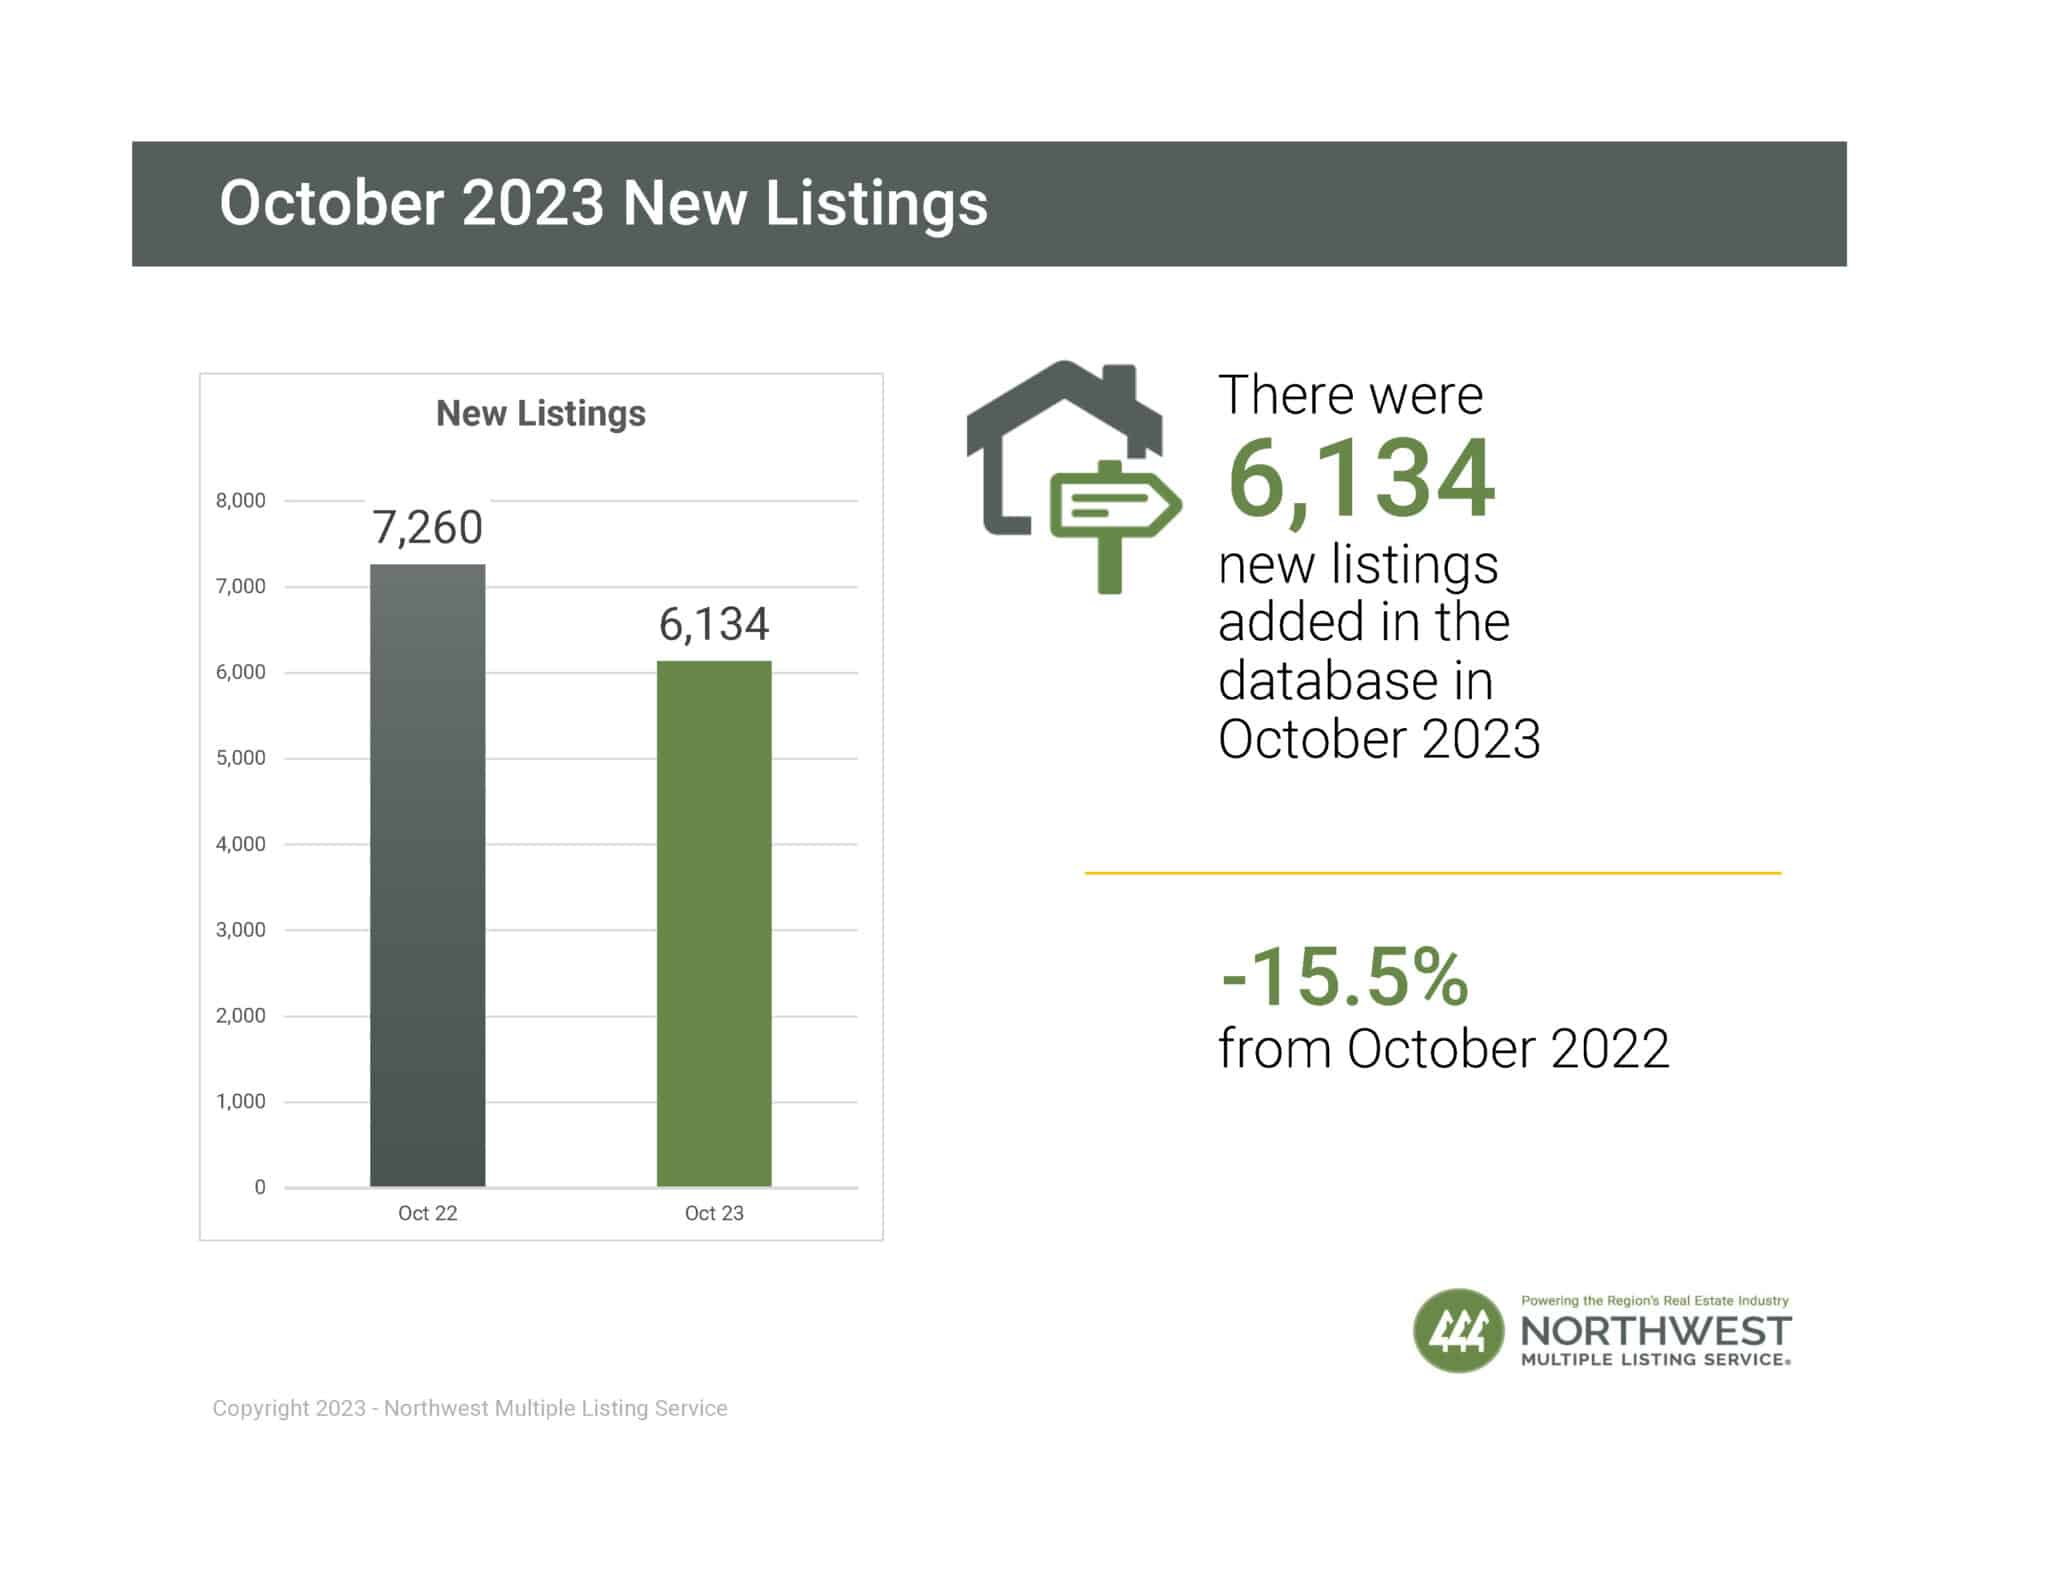
New Listings
There were 6,134 new listings added in the database for this month.
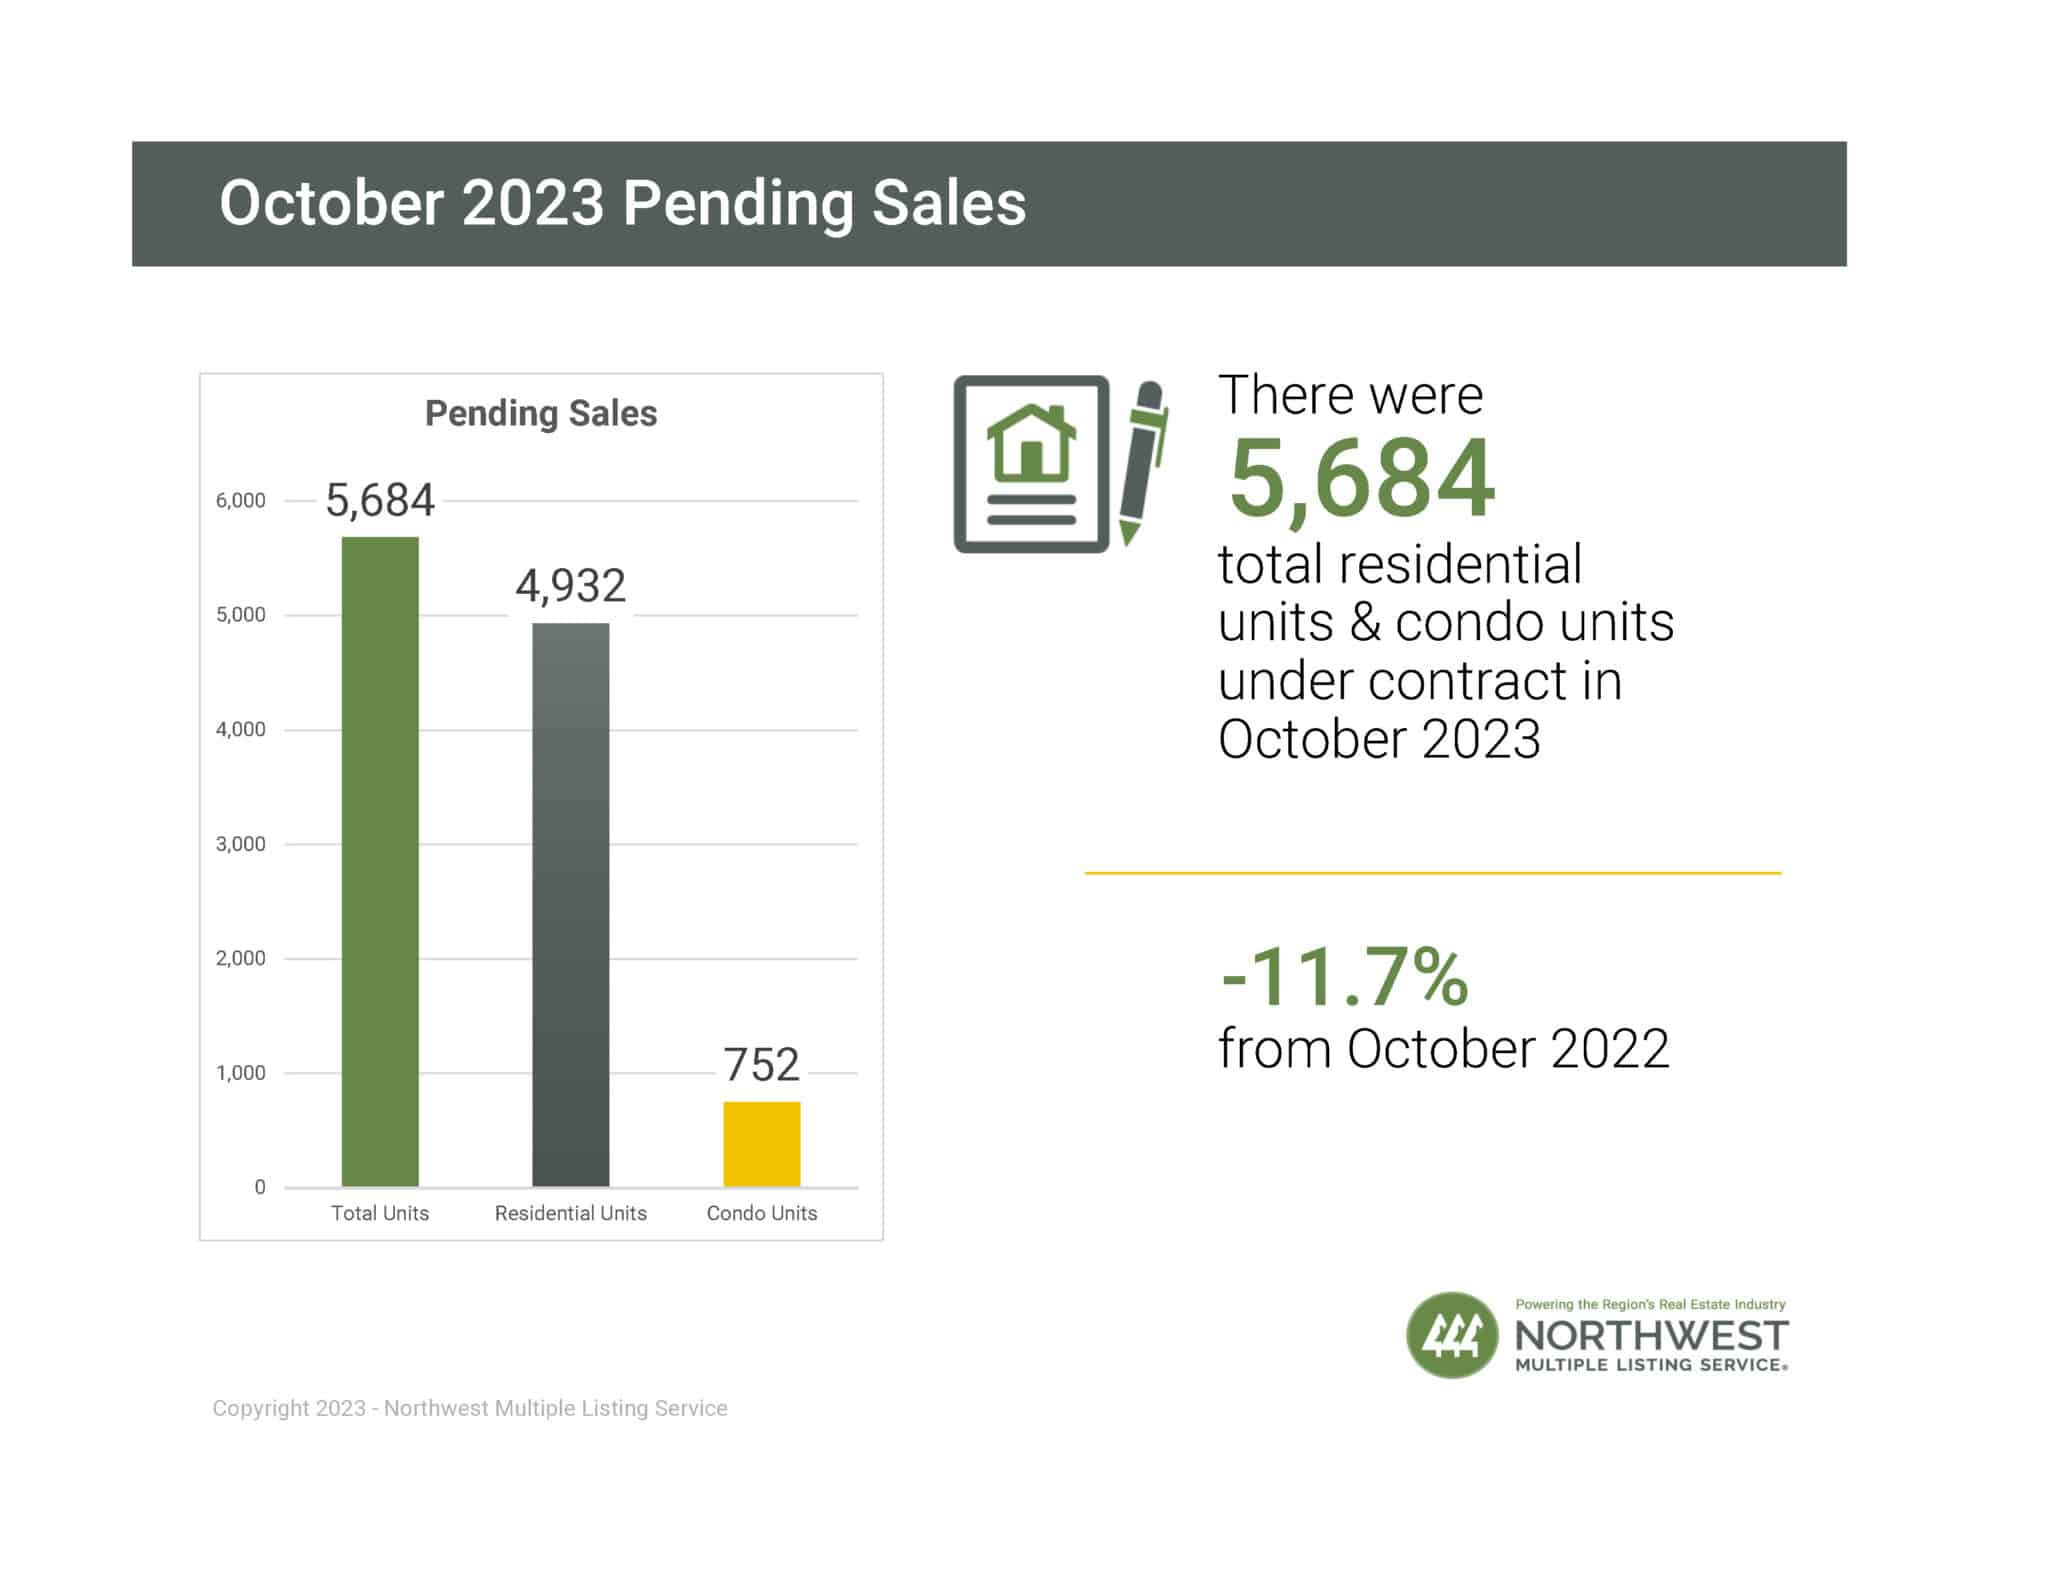
Pending Sales
There were 5,684 total residential units & condo units under contract for this month.
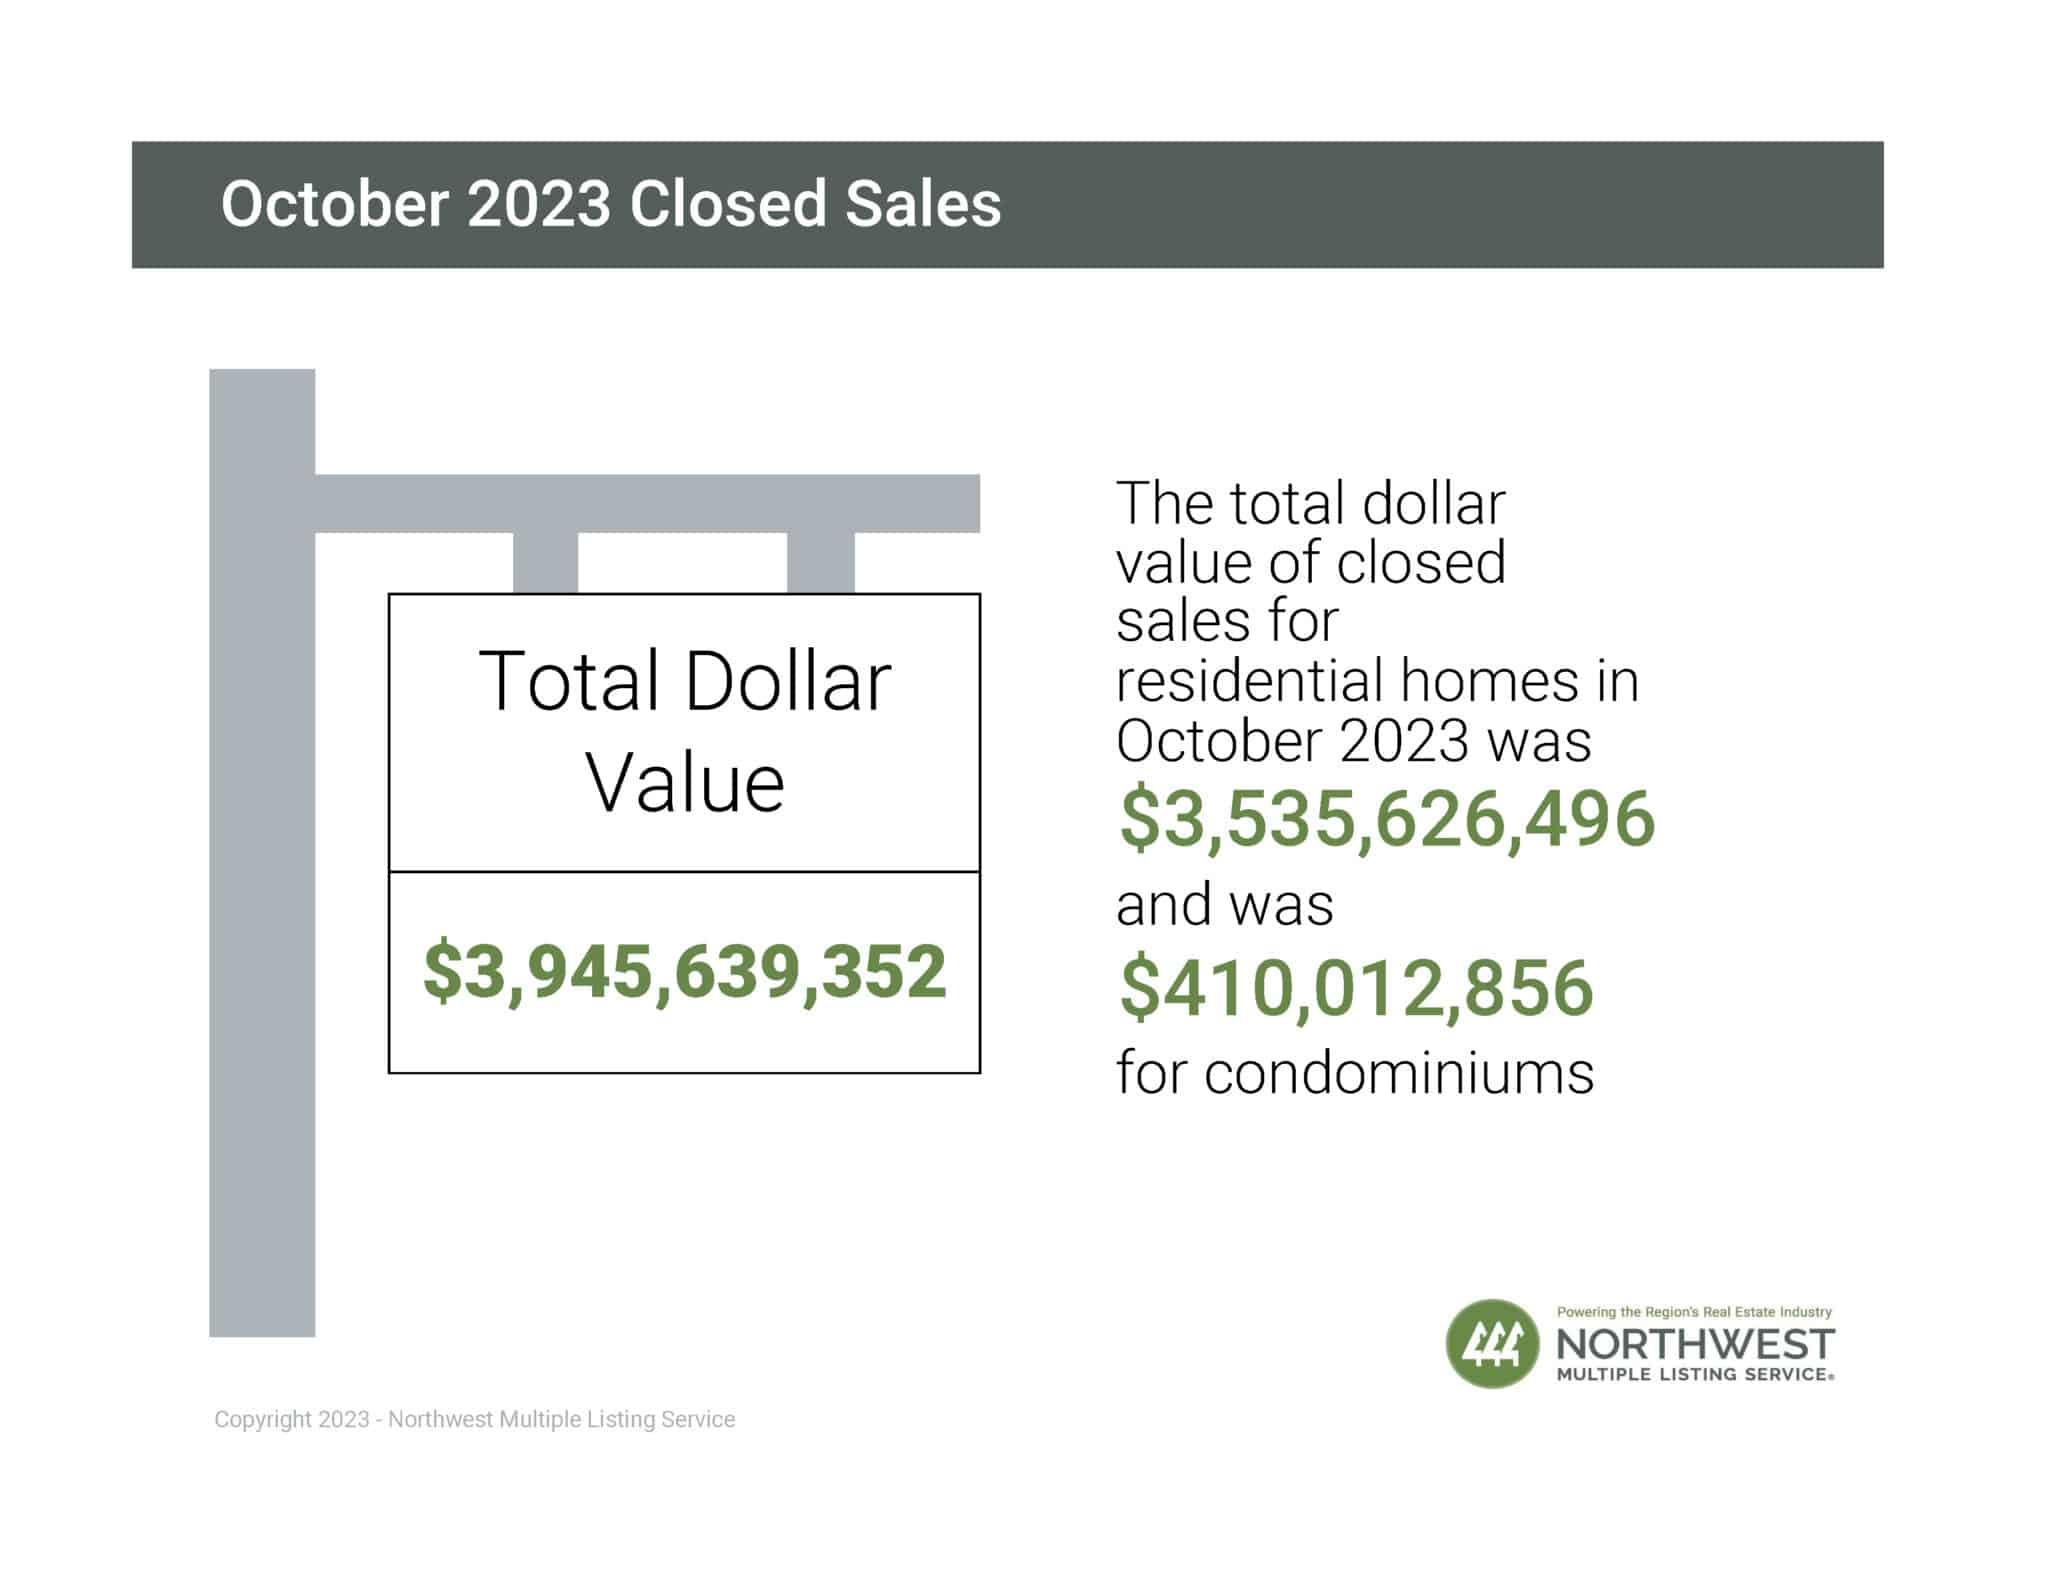
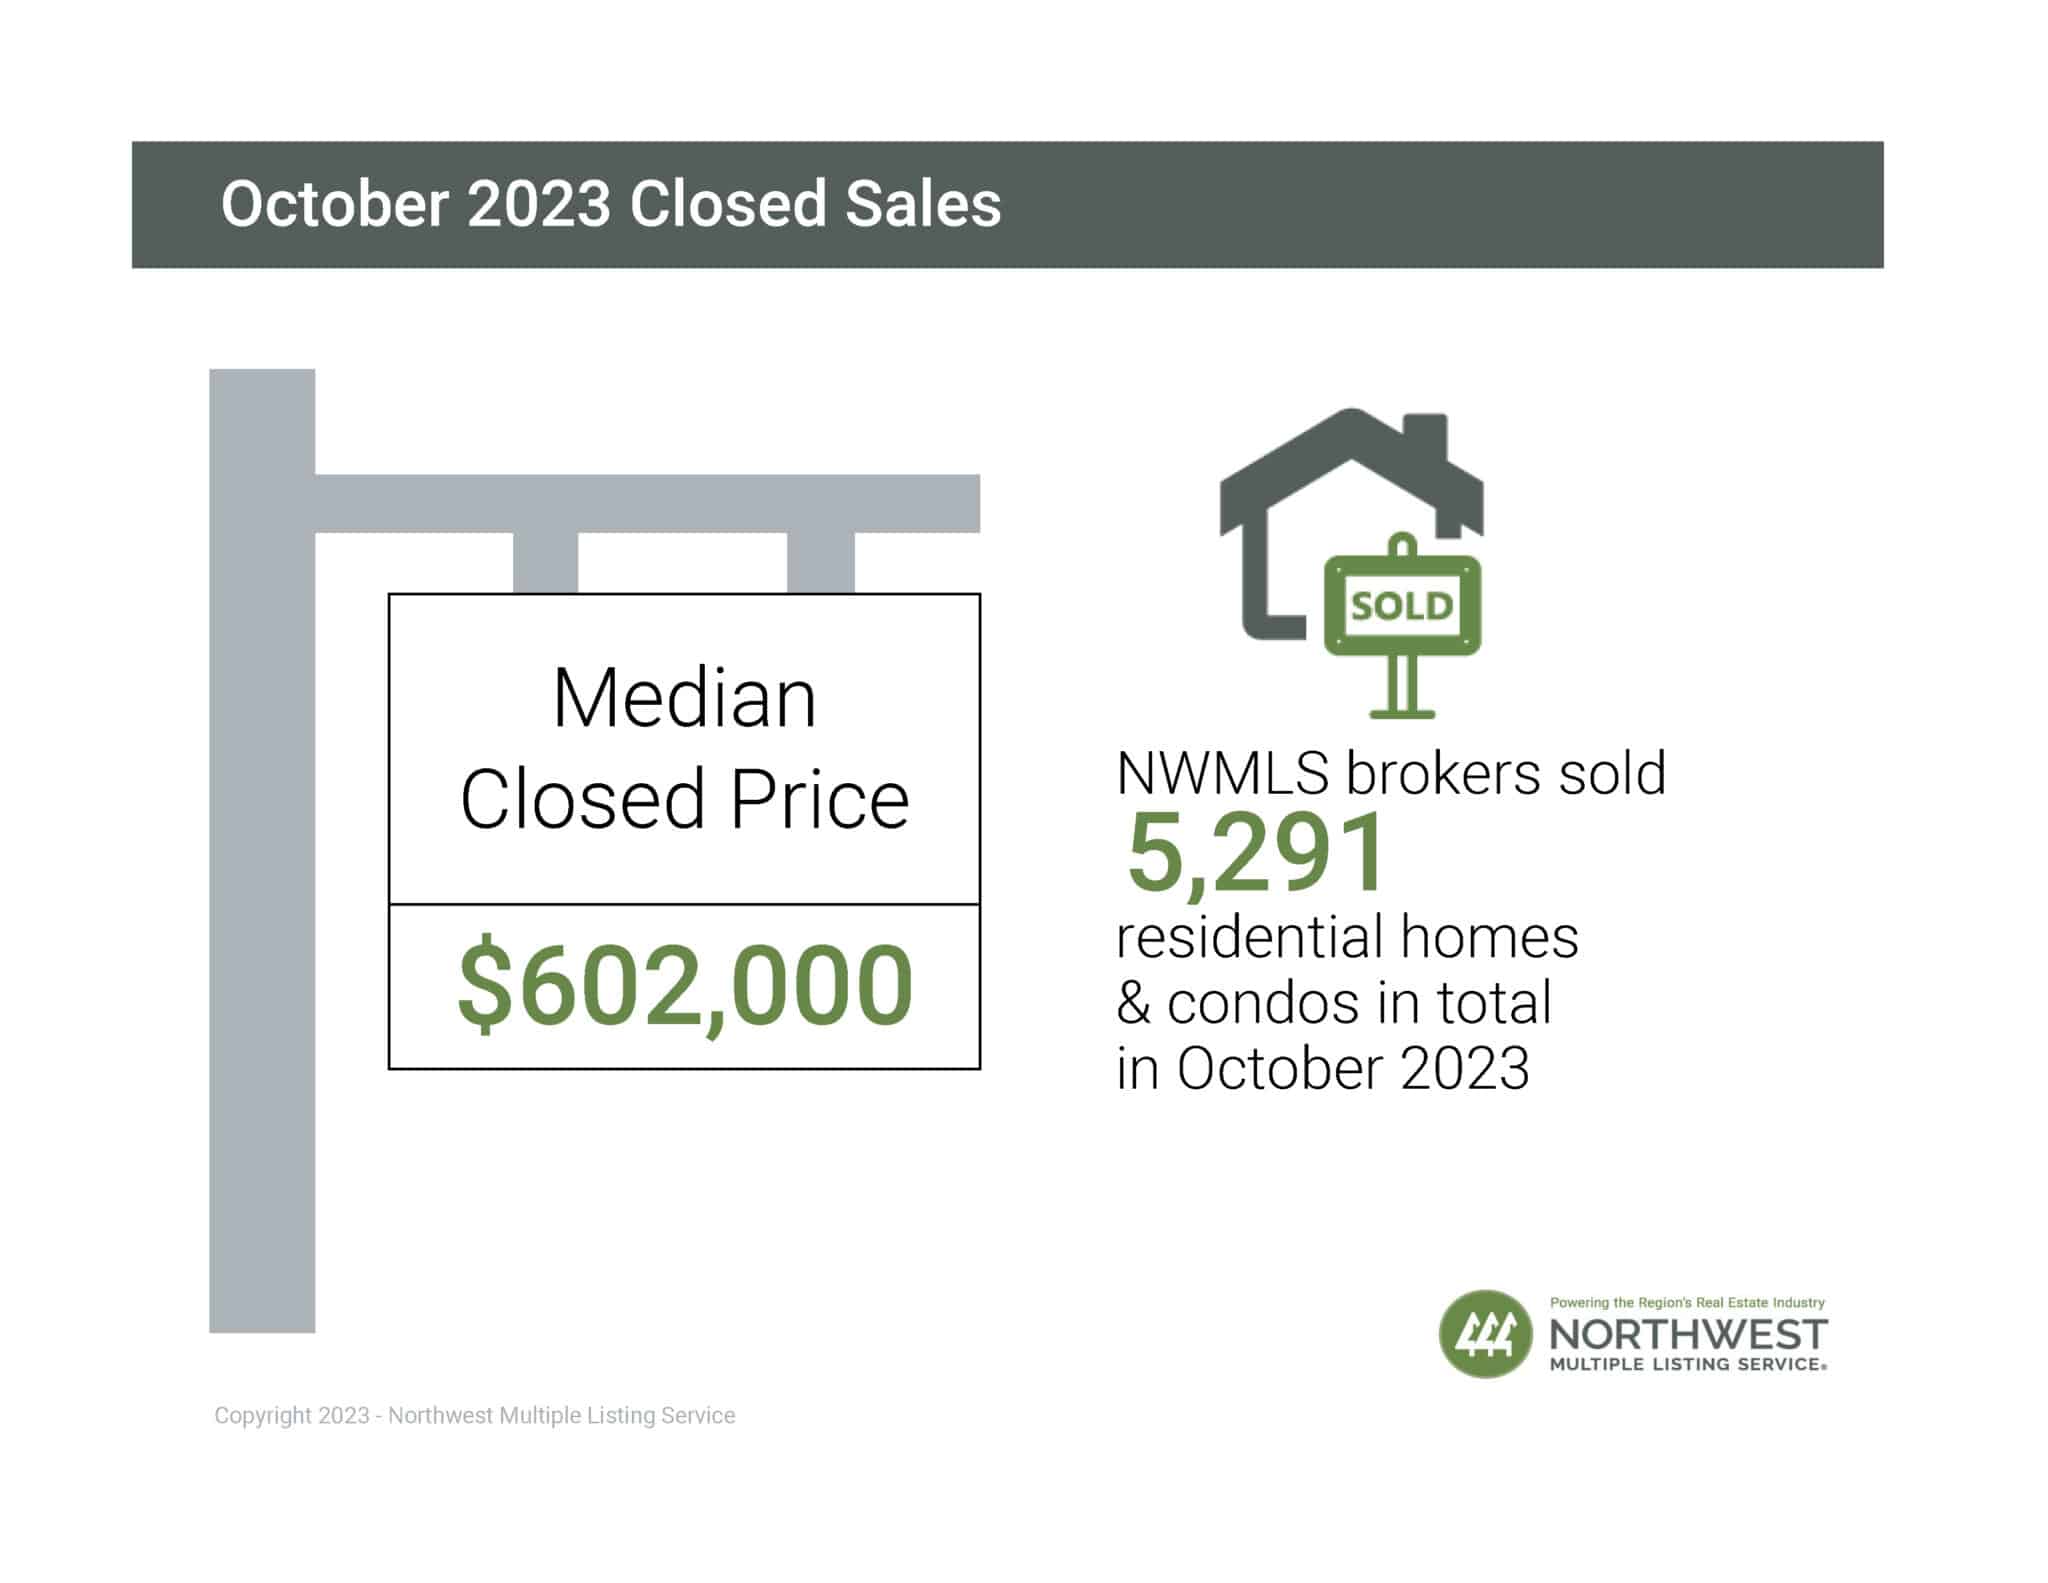
Closed Sales
The total dollar value of closed sales for residential homes for this month was $3,535,626,496 and was $410,012,856 for condominiums.
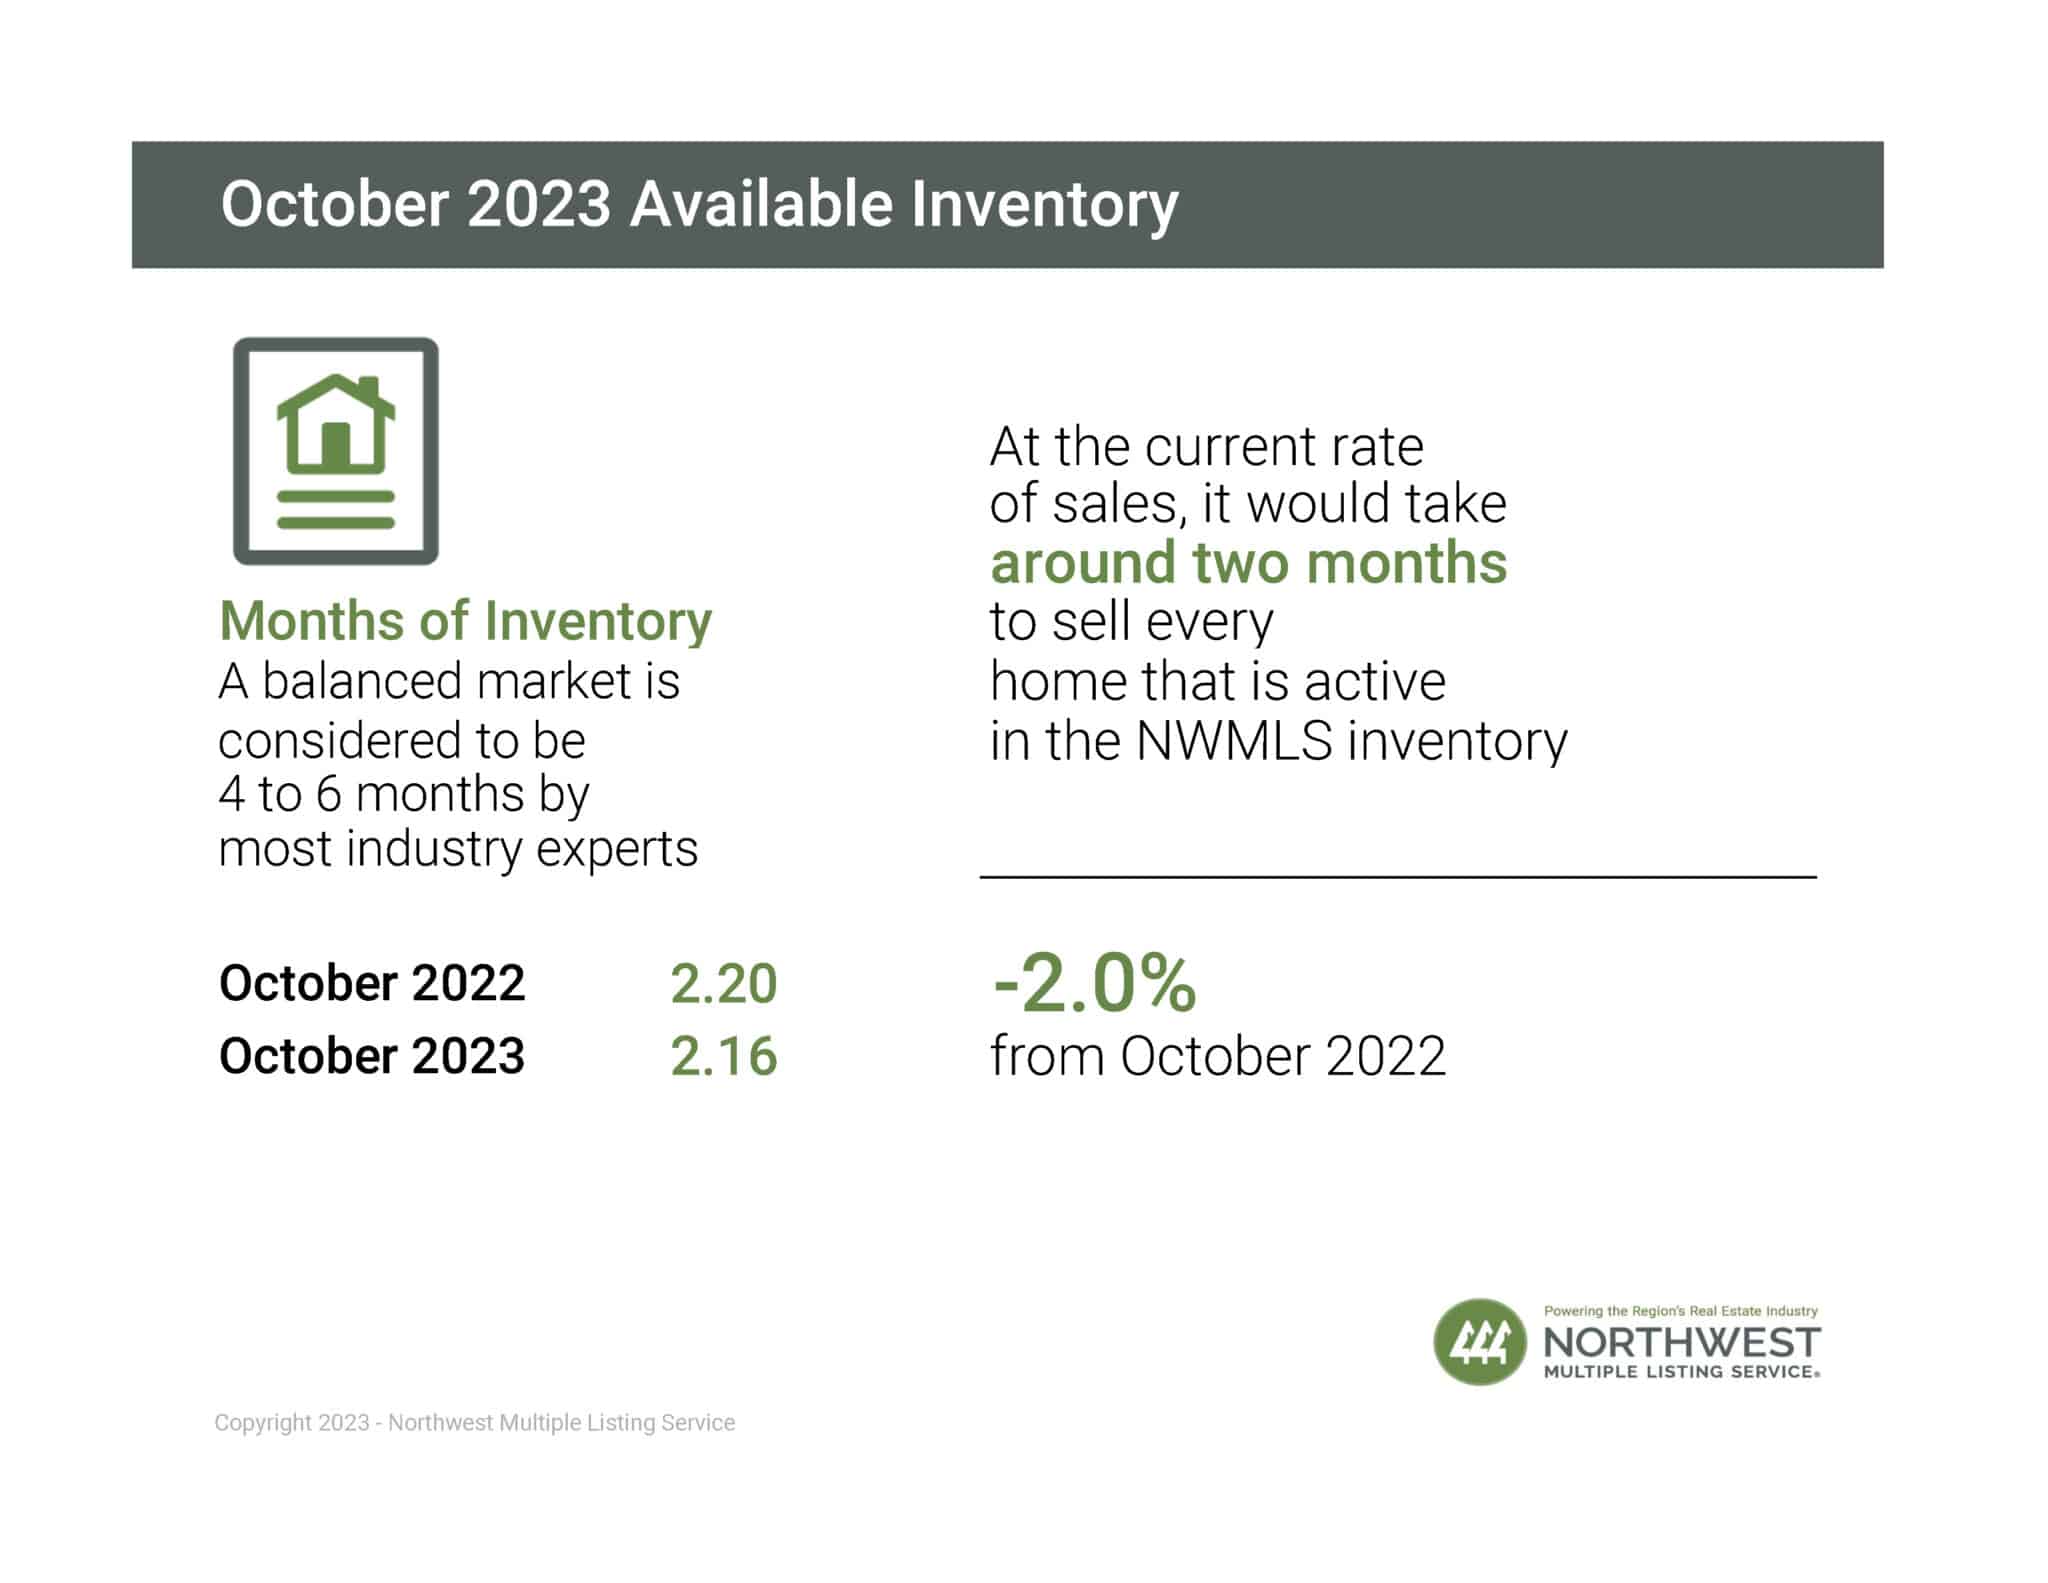
Months of Inventory
A balanced market is considered to be 4 to 6 months by most industry experts. At the current rate of sales, it would take around two months to sell every home that is active in the NWMLS inventory.
Median Price
NWMLS Brokers sold 5,291 residential homes & condos in total for this month.
View Individual Counties in PDF Format

Historical Charts
Get granular on real estate statistics with interactive 5-year charts encompassing the length of active, new, and additional metrics.
Usage Terms
You may share and republish NWMLS’s Market Snapshot Video, interactive charts, and infographics on websites, blogs, and social media. Any use of NWMLS’s statistical charts or infographics must include the logo that is displayed on the graphics and the following attribution: “Information and statistics compiled and reported by the Northwest Multiple Listing Service.” You may not alter or otherwise modify NWMLS’s Market Snapshot Video, interactive charts, and infographics. Derivatives of NWMLS’s housing marketing statistics may not be published, broadcast, rewritten or redistributed without prior written permission.