July 2025 Overview
Market Update
Market holds steady as high mortgage rate persists
Interactive County Charts
Visualize year-over-year real estate statistics for specific counties, such as active listings, new listings, pending sales, closed sales, and months of inventory.
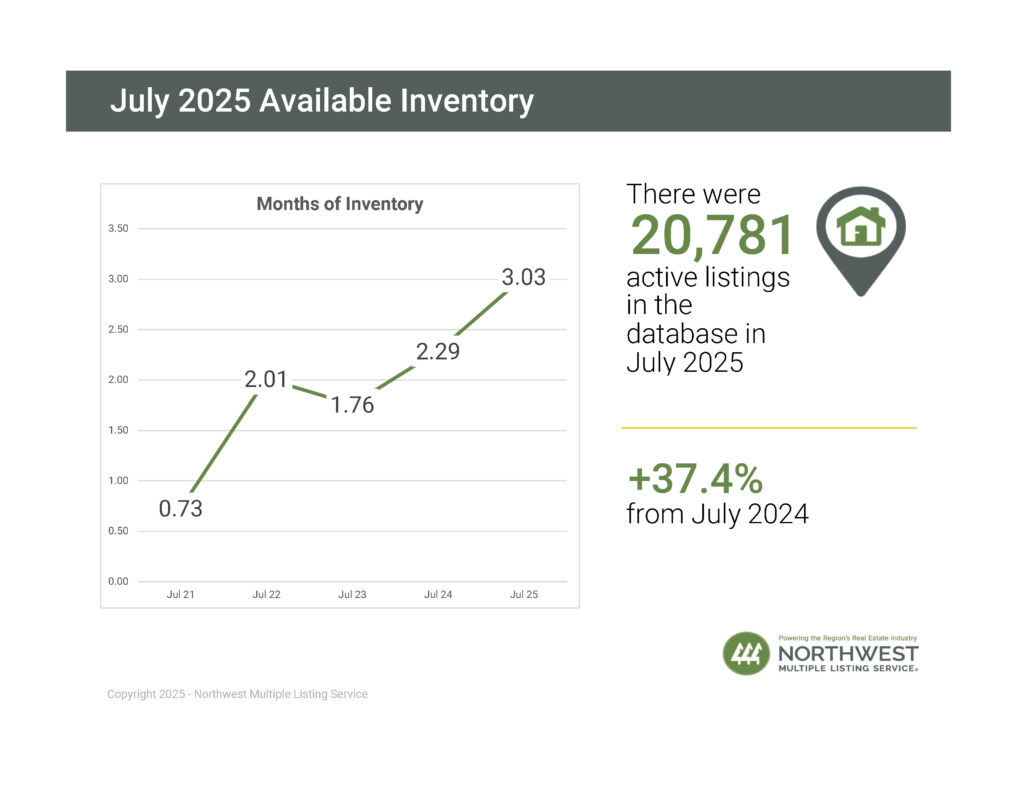
Active Listings
There was a 37.42% increase in total number of properties listed for sale year-over-year, with 20,781 active listings on the market at the end of July 2025, compared to 15,122 at the end of July 2024. When compared to the previous month, active inventory increased by 944 listings (+4.76%), up from 19,837 in June 2025.
The number of homes for sale year-over-year increased throughout the NWMLS coverage area, with 26 out of 27 counties seeing a double-digit year-over-year increase (all counties except Okanogan, which increased by 8.7%). The six counties with highest year-over-year increases in active inventory for sale were Ferry (+60%), Snohomish (+53.56%), Clallam (+52.91%), Columbia (+52.17%), Thurston (+46.86%), and Grant (+44.51%).
Use the drop-down menu in the chart below to view the available inventory counts in each county:
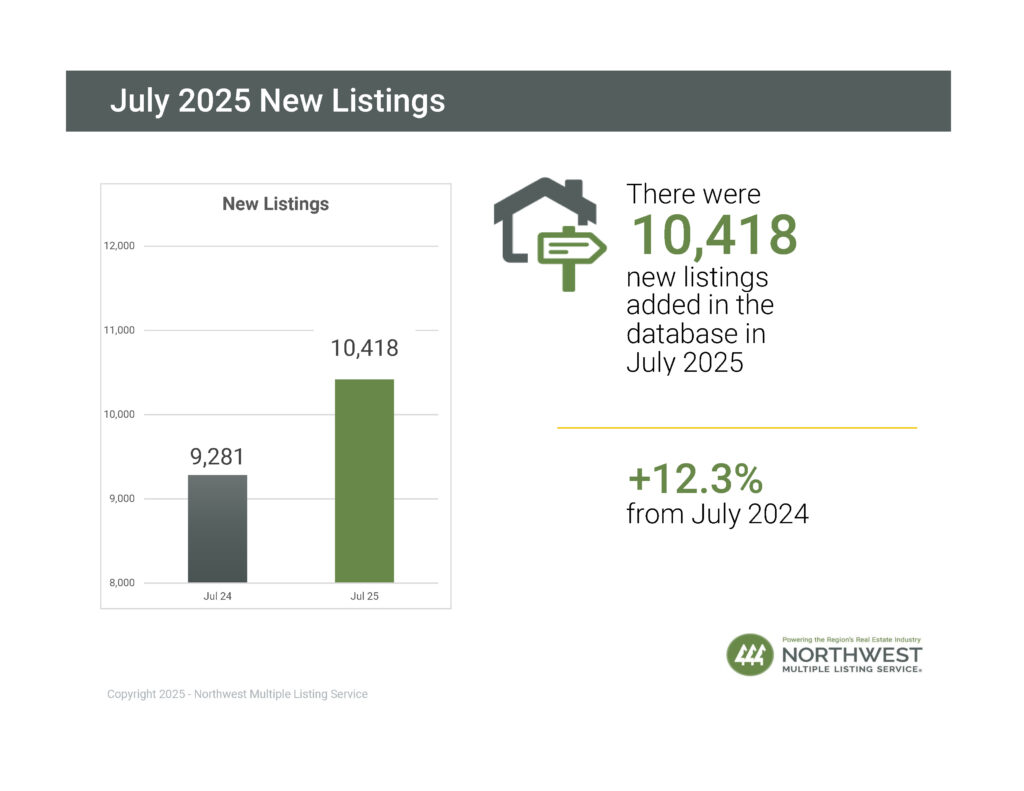
New Listings
NWMLS brokers added 10,418 new listings to the database in July 2025, a year-over-year increase of 12.25% compared to July 2024 (9,281). When compared to the previous month (June 2025), new listings decreased by 4.99%, when 10,965 listings were added to the NWMLS database.
The number of new listings increased year-over-year in 23 of 27 counties. The six counties with the largest year-over-year increases were Clallam (+55.96%), Ferry (+50%), Island (+27.27%), Jefferson (+26.56%), Thurston (+26.25%), and Lewis (+26.02%).
Use the drop-down menu in the chart below to view the number of new listings added in each county:
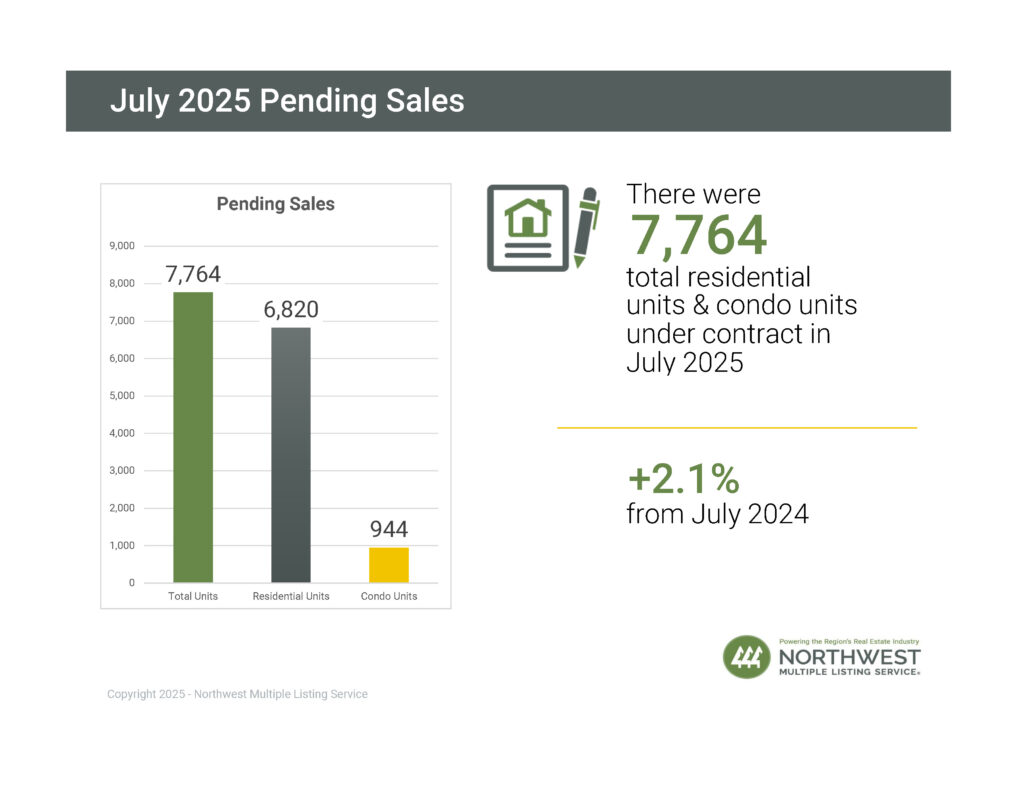
Pending Sales
There were 7,764 residential units & condo units under contract in July 2025, an increase of 2.08% when compared to July 2024 (7,606). When compared to the previous month, the number of pending listings decreased by 0.47%, down from 7,801 listings under contract in June 2025.
Use the drop-down menu in the chart below to view the pending sales in each county:
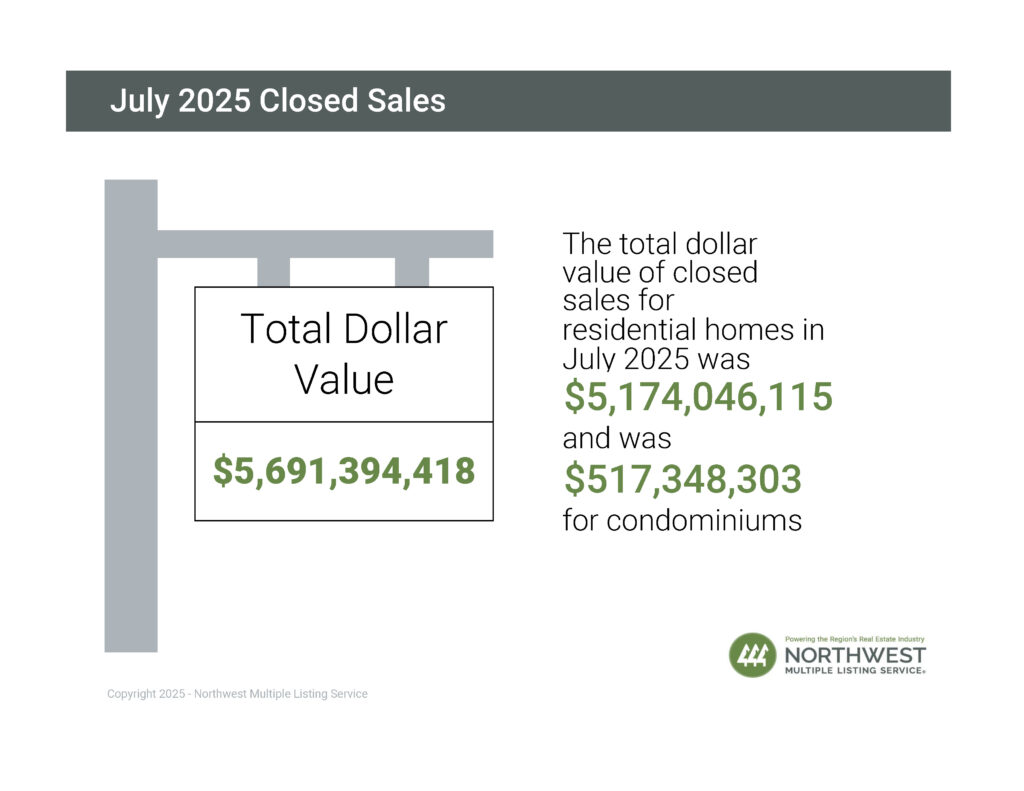
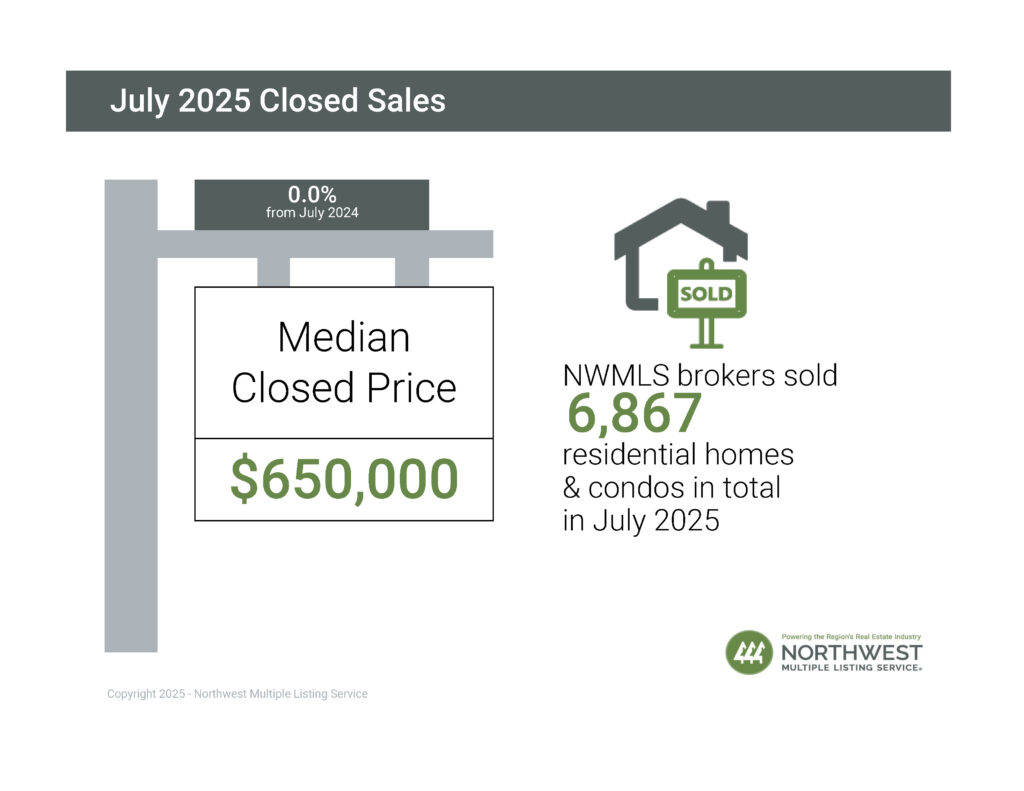
Closed Sales
The number of closed sales increased by 3.81% year-over-year (6,867 in July 2025 compared to 6,615 in July 2024). When compared to the previous month, the number of closed sales increased by 2.58%, up from 6,694 sales in June 2025.
19 out of 27 counties saw an increase in the number of closed sales year-over-year. The six counties with the largest increases were San Juan (+100%), Adams (+75%), Pacific (+71.43%), Ferry (+66.67%), Clallam (+47.56%), and Grant (+30%). The total dollar value of closed sales in July 2025 for residential homes was $5,174,046,115 and was $517,348,303 for condominiums ($5,691,394,418 in total).
Use the drop-down menu in the chart below to view the number of closed sales in each county:
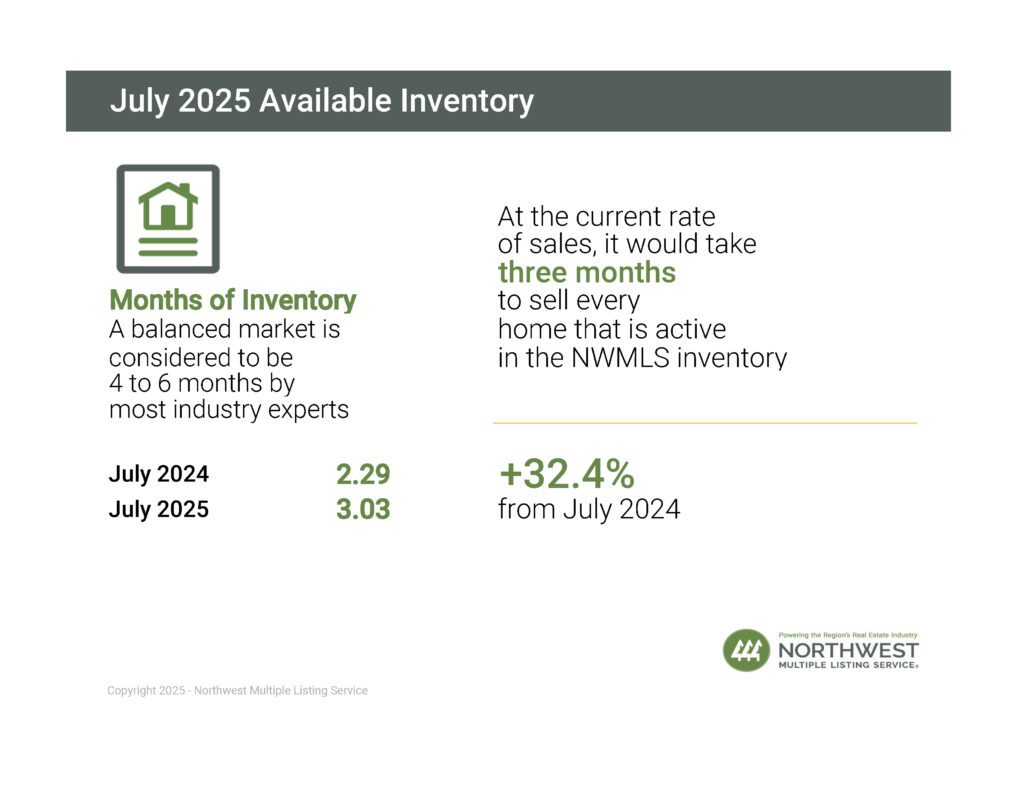
Months of Inventory
A balanced market is considered to be 4 to 6 months by most industry experts. At the current rate of sales, it would take around 3 months (2.03) to sell every home that is active in the NWMLS inventory. The six counties with the lowest months of inventory in July 2025 were: Kitsap (2.29), Snohomish (2.32), Thurston (2.49), Pierce (2.60), King (2.76) and Clallam (2.82).
Use the drop-down menu in the chart below to view the months of inventory in each county:
Median Price
The median sales price for residential homes and condominiums sold in July 2025 was $650,000 — unchanged from July 2024. Compared to the previous month, the median price declined 2.99%, down from $670,000 in June 2025.
The three counties with the highest median sale prices were San Juan ($906,250), King ($875,000), and Snohomish ($765,000), and the three counties with the lowest median sale prices were Columbia ($257,250), Ferry ($275,000), and Adams ($349,999).
Use the drop-down menu in the chart below to view the median sales price in each county:

Market Snapshot Video
Watch a short video with the most current real estate statistics – great to share with clients!
View Individual Counties Breakout Reports in PDF Format

Historical Charts
Get granular on real estate statistics with interactive 5-year charts encompassing the length of active, new, and additional metrics.
Usage Terms
You may share and republish NWMLS’s Market Snapshot Video, interactive charts, and infographics on websites, blogs, and social media. Any use of NWMLS’s statistical charts or infographics must include the logo that is displayed on the graphics and the following attribution: “Information and statistics compiled and reported by the Northwest Multiple Listing Service.” You may not alter or otherwise modify NWMLS’s Market Snapshot Video, interactive charts, and infographics. Derivatives of NWMLS’s housing marketing statistics may not be published, broadcast, rewritten or redistributed without prior written permission.