November 2025 Overview
Market Update
Rising Inventory Amid Slower Sales
Interactive County Charts
Visualize year-over-year real estate statistics for specific counties, such as active listings, new listings, pending sales, closed sales, and months of inventory.
Active Listings
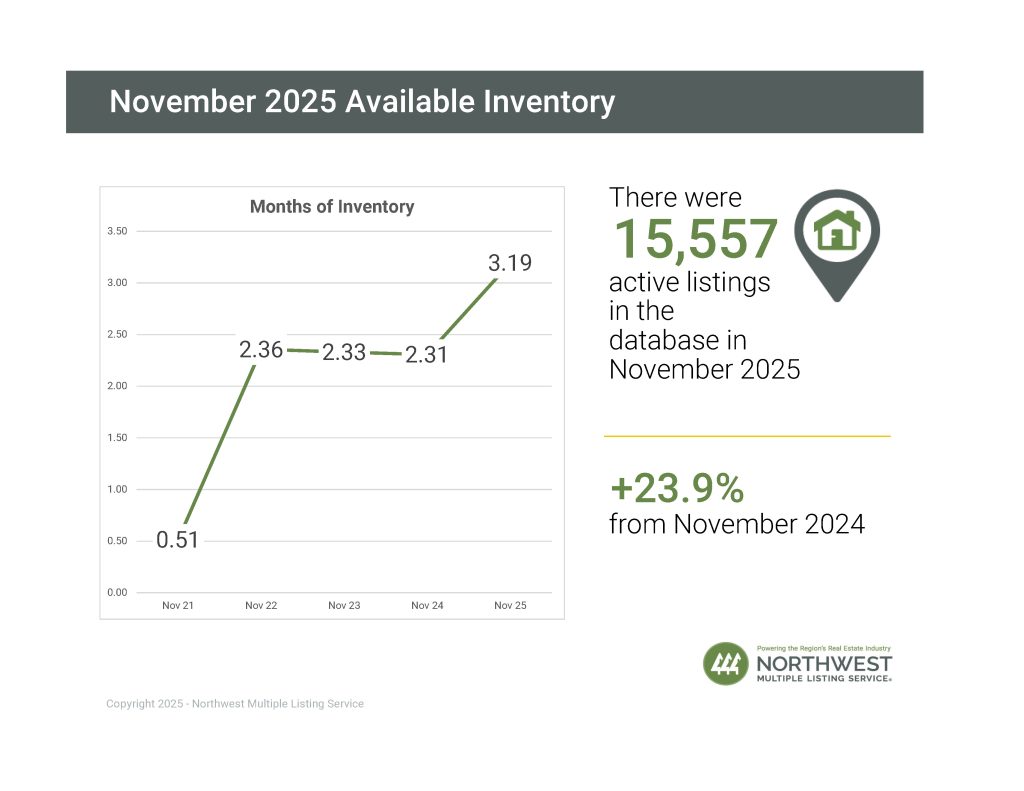
There was a 23.9% increase in total number of properties listed for sale year-over-year, with 15,557 active listings on the market at the end of November 2025, compared to 12,558 at the end of November 2024. When compared to the previous month, active inventory decreased by 3,234 listings (-17.2%), down from 18,791 in October 2025.
The number of homes for sale year-over-year increased in all of NWMLS’s coverage area, with 20 out of 27 counties seeing a double-digit year-over-year increase. The six counties with highest year-over-year increases in active inventory for sale were Jefferson (+47.9%), Thurston (+46.6%), Snohomish (+41.7%), Walla Walla (+38.7%), Clallam (+35.6%), and Okanogan (+33.8%).
Use the drop-down menu in the chart below to view the available inventory counts in each county:
New Listings
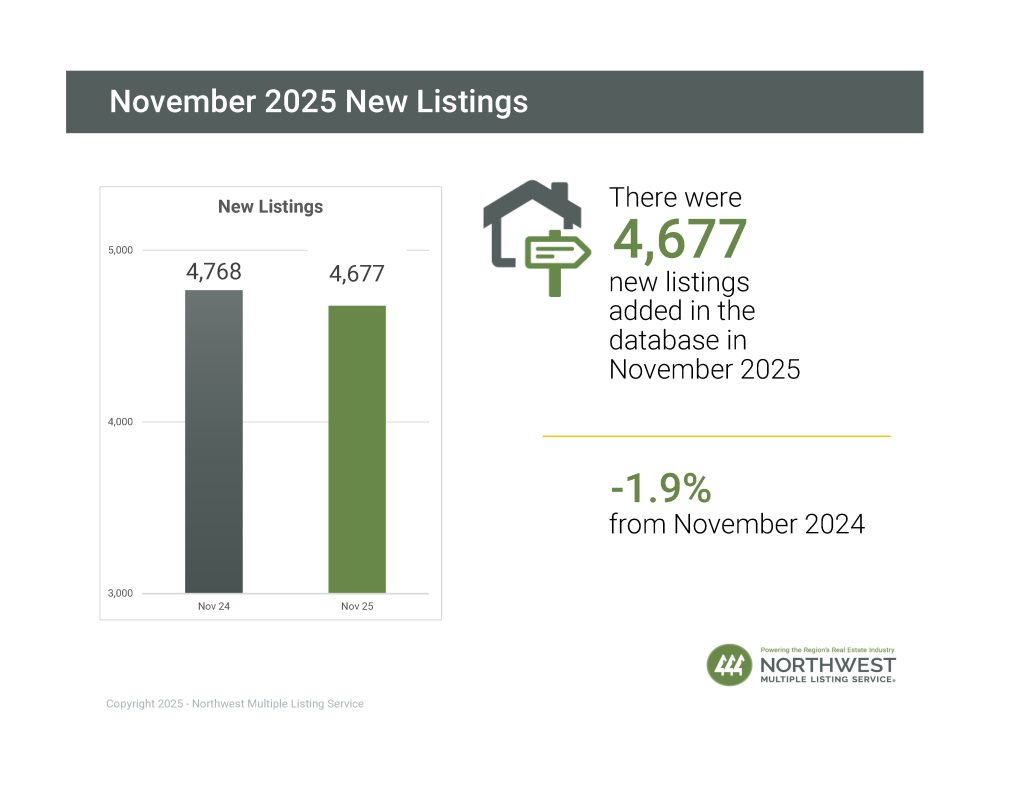
NWMLS brokers added 4,677 new listings to the database in November 2025, a year-over-year decrease of 1.9% compared to November 2024 (4,768). When compared to the previous month (October 2025), new listings decreased by 41.5%, when 7,991 listings were added to the NWMLS database.
When looking at the 27 individual counties in NWMLS’s primary service area, the number of new listings decreased year-over-year in 12 counties, increased year-over-year in 12 counties, and remained the same in 3 counties. The six counties with the largest year-over-year decreases were Pacific (-41.4%), Mason (-28.7%), Skagit (-27.5%), Island (-21.4%), Douglas (-18%), and Whatcom (-14%).
Use the drop-down menu in the chart below to view the number of new listings added in each county:
Pending Sales
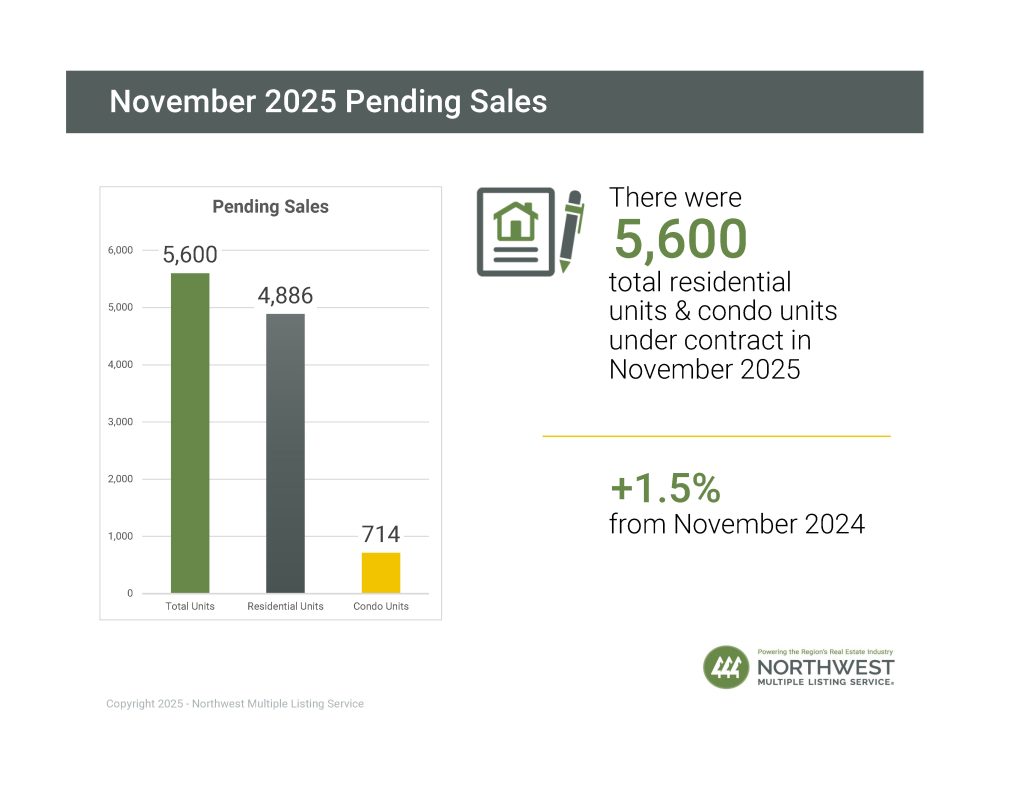
There were 5,600 residential units & condo units under contract in November 2025, a slight increase of 1.5% when compared to November 2024 (5,516). When compared to the previous month, the number of pending listings decreased by 16.9%, down from 6,739 listings under contract in October 2025.
Use the drop-down menu in the chart below to view the pending sales in each county:
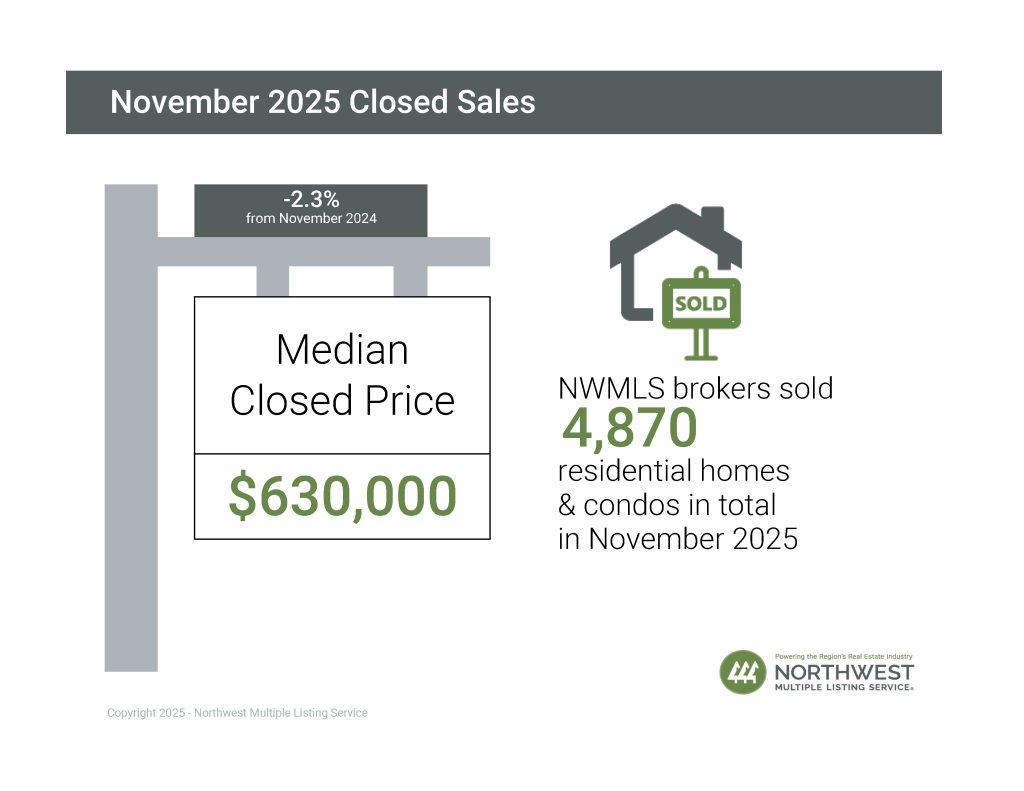
Closed Sales
The number of closed sales decreased by 10.9% year-over-year (4,870 in November 2025 compared to 5,446 in November 2024). When compared to the previous month, the number of closed sales decreased by 21.7%, down from 6,222 sales in October 2025.
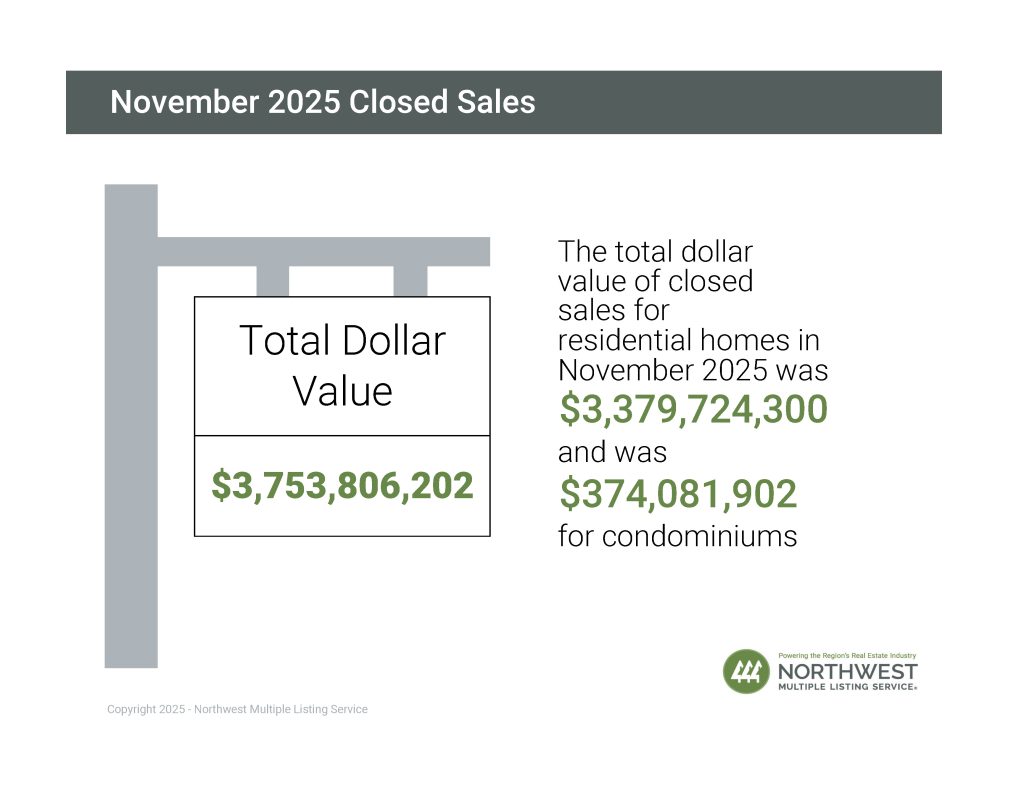
18 out of 27 counties saw a decrease in the number of closed sales year-over-year, while 6 saw an increase, and 3 showed no change. The six counties with the largest decreases were Okanogan (-34.3%), Chelan (-26.7%), Skagit (-23.2%), Kitsap (-20.1%), Mason (-14.6%), and Snohomish (-14.6%). The total dollar value of closed sales in November 2025 for residential homes was $3,379,724,300 and was $374,081,902 for condominiums ($3,753,806,202 in total).
Use the drop-down menu in the chart below to view the number of closed sales in each county:
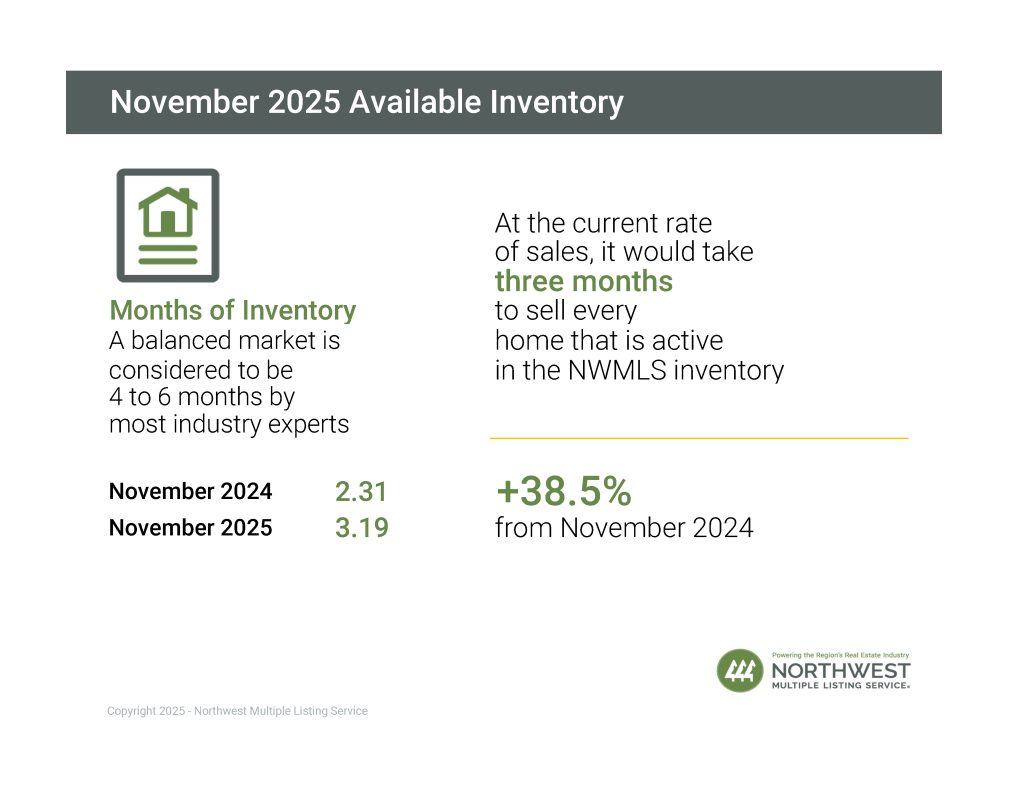
Months of Inventory
A balanced market is considered to be 4 to 6 months by most industry experts. At the current rate of sales, it would take a little more than 3 months (3.19) to sell every home that is active in the NWMLS inventory. The six counties with the lowest months of inventory in November 2025 were Kitsap (2.24), Snohomish (2.28), King (2.82), Pierce (2.85), Island (3.03), and Thurston (3.03).
Use the drop-down menu in the chart below to view the months of inventory in each county:
Median Price
A balanced market is considered to be 4 to 6 months by most industry experts. At the current rate of sales, it would take a little more than 3 months (3.19) to sell every home that is active in the NWMLS inventory. The six counties with the lowest months of inventory in November 2025 were Kitsap (2.24), Snohomish (2.28), King (2.82), Pierce (2.85), Island (3.03), and Thurston (3.03).
Use the drop-down menu in the chart below to view the median sales price in each county:

Market Snapshot Video
Watch a short video with the most current real estate statistics – great to share with clients!
View Individual Counties Breakout Reports in PDF Format

Historical Charts
Get granular on real estate statistics with interactive 5-year charts encompassing the length of active, new, and additional metrics.
Usage Terms
You may share and republish NWMLS’s Market Snapshot Video, interactive charts, and infographics on websites, blogs, and social media. Any use of NWMLS’s statistical charts or infographics must include the logo that is displayed on the graphics and the following attribution: “Information and statistics compiled and reported by the Northwest Multiple Listing Service.” You may not alter or otherwise modify NWMLS’s Market Snapshot Video, interactive charts, and infographics. Derivatives of NWMLS’s housing marketing statistics may not be published, broadcast, rewritten or redistributed without prior written permission.