Published on:
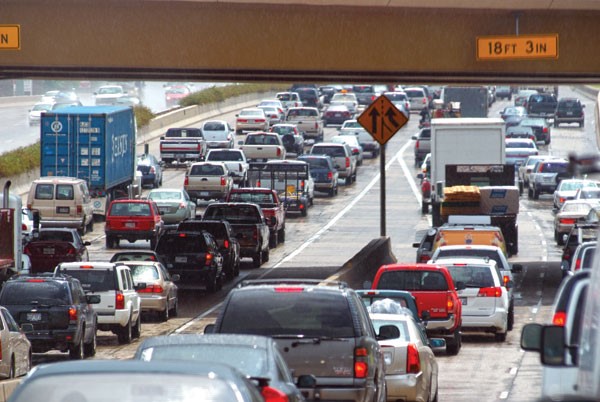 Seattle’s traffic congestion ranks behind 11 other urban areas, but in terms of lost dollars it placed 9th. Congestion cost the average Emerald City commuter 78 hours of time in 2017 and an estimated $1,408 in dollars according to the 2019 Urban Mobility Report from Texas A&M Transportation Institute (TTI).
Noting no single approach will solve the complex gridlock problem, researchers calculated the economic consequences, including:
- the number of hours per commuter lost to traffic delay has nearly tripled, climbing to 54 hours a year; in Seattle, it’s 78 hours;
- the annual cost of that delay per commuter has nearly doubled, to $1,010; in Seattle, it’s $1,408 (39% higher);
- the nationwide cost of gridlock has grown more than tenfold, to $166 billion a year; and
- the amount of fuel wasted in stalled traffic has more than tripled, to 3.3 billion gallons a year; in Seattle it’s more than 62.7 million gallons.
Roadway gridlock was once considered a problem exclusive to big cities, but it now afflicts urban areas of all sizes and consumes far more of each day, making “rush hour” a long-outdated reference.
Moreover, says Bill Eisele, a report author, “The problem affects not only commuters, but also manufacturers and shippers whose travel delay costs are passed on to consumers.” Eisele, a TTI senior research engineer, also noted while trucks constitute only 7 percent of road traffic, they account for 12 percent of congestion cost.
Researchers emphasize the urgency of developing national consensus on specific strategies for each urban travel corridor since major projects, programs and funding strategies take a decade or more to develop and yield results.
“We know what works,” said Tim Lomax a report author and Regents Fellow at TTI. “What the country needs is a robust, information-powered conversation at the local, state and national levels about what steps should be taken. We have many strategies; we have to figure out the right solution for each problem and a way to pay for them.”
Among strategies researchers have long advocated are “more of everything” – roads, transit, squeezing as much efficiency out of the existing system as possible, reducing demand through telework, better balancing demand and roadway capacity by adjusting work hours, and smarter land use.
“The value of investing in our nation’s transportation infrastructure in a strategic and effective manner cannot be overstated as these added costs impact our national productivity, quality of life, economic efficiency and global competitiveness,” said Marc Williams, deputy executive director of the Texas Department of Transportation, which funded the TTI research. He noted the 2008-2009 recession produced only a brief pause in traffic congestion growth, which bounced back at an even quicker pace than associated job recovery.
TTI said the result is that the average freeway traveler has to allow almost twice the expected trip duration to ensure dependable arrival for time-sensitive things like medical appointments, day-care pickup, and airline flights. Instead of the 20 minutes needed in light traffic, it’s best to plan a 34-minute trip.
 The 2019 Urban Mobility Report, supported by INRIX (a leading provider of transportation data and analytics) examined conditions in 494 urban areas across all states and Puerto Rico. It includes links to a nationwide interactive map of congestion conditions.
The report also outlines dozens of evolving strategies for addressing roadway gridlock, sortable by type, cost, time to implement, geographic impact and who is responsible. The authors emphasize while there is no single quick fix, each strategy represents a part of the solution.