Published on:
Home buyers around Washington state found the largest selection of listings last month since December. Both pending sales and closed sales reached their highest volume in months. Brokers at Northwest Multiple Listing Service (NWMLS) welcomed the uptick in activity but say rising interest rates are crimping activity.
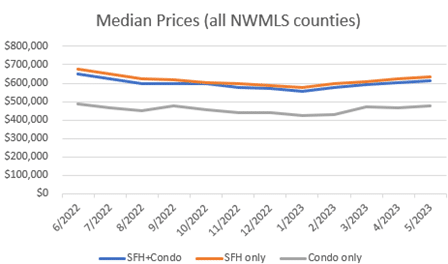
Northwest MLS statistics for May show the area-wide median price of $615,000 is down 6.8% from the year-ago figure of $660,000, but it’s up nearly 10.4% since January when the median sales price was $557,250. The figures reflect sales of single family homes and condominiums across 26 counties.
“Median prices have continued to decline year-over-year in the overall NWMLS service area,” said John Deely, executive vice president of operations at Coldwell Banker Bain. “Following a national trend, our market pricing peaked in April/May of 2022 with a steady decline through the end of the year,” he noted, adding, “However, 2023 has seen slow and steady growth in median prices. As an example, King County residential has had an increase of 16.5% YTD for 2023. Buyers waiting for prices to come down will be disappointed based on current trends.”
House-hunters could choose from 9,079 active listings in the MLS database at the end of May, the highest level since December. Compared to a year ago, there are about 3.2% more listings. Despite the increase, inventory remains tight with only 1.44 months of supply.
The selection was even more limited across the four-county Puget Sound region, with Snohomish County reporting about 3.5 weeks of supply (0.88 months of inventory). Pierce County was slightly better at 1.09 months, followed by King (1.26 months) and Kitsap (1.3 months). Industry experts consider four-to-six months to be a balanced market.
“In May, there were both fewer resale listings and a lower number of homes going under contract compared to the same month a year ago,” noted J. Lennox Scott, executive officer at John L. Scott Real Estate. “However, for homes in the more affordable and mid-priced range, we are experiencing an elevated level of Sales Activity Intensity™” (an index that company uses for the percentage of new resale listings going under contract in the first 30 days on the market).
Scott believes the sales intensity is “powering the normal seasonal upward trend of the region’s median home price that happens each year during the spring months.”
Brokers added 9,247 new listings during May and reported 8,120 pending sales (mutually accepted offers). The new listings volume was well below the year-ago total of 13,075, but easily surpassed April’s figure (7,303) and was the highest monthly number since September when brokers added 9,422 new listings.
“Buyers remain selective with lifestyle changes as their main consideration,” reported Dean Rebhuhn, owner at Village Homes and Properties. He said Kittitas County is attractive to westside buyers with good prices and availability.
Northwest MLS data show the median price of homes that sold last month in Kittitas County was $560,000, well below the figure of $816,750 for sales in King County. Kittitas currently has about 3.4 months of supply, whereas in King County there is less than 1.3 months of supply.
Last month’s pending sales volume (8,120) was down 23% from a year ago, but up nearly 13.8% from April’s total (7,137). Twenty-two of the 26 counties in the MLS report experienced double-digit declines compared to a year ago. All but four counties improved on April’s pending sales.
May’s pending sales of single family homes and condominiums (combined) marked the highest monthly total since August when brokers notched 9,552 mutually accepted offers.
Closed sales followed a similar pattern. Brokers reported 6,310 completed transactions last month, down 30.6% from a year earlier, but up 18.2% when compared to April. Last month’s closings marked the highest number since October’s total of 6,464.
The year-over-year drop in median prices, at -6.8%, was the smallest decline since February when YOY prices declined 1.7%. Compared to January, all but four of the 26 counties in the report show year-to-date price gains, including 12 counties with double-digit increases.
| 6/2022 | 1/2023 | 5/2023 | % change since Jan | |
| SFH+Condo | $650,000 | $557,250 | $615,000 | 10.36% |
| SFH only | $675,000 | $579,000 | $636,000 | 9.84% |
| Condo only | $485,000 | $424,000 | $475,000 | 12.03% |
Condo inventory is 22.6% larger than a year ago, with 1,217 active listings offered for sale as of the end of May. New listings (1,177) outpaced pending sales (1,037). Last month’s pending sales were down 19.1% from a year ago, but volumes have risen steadily since December. Last month’s number of mutually accepted offers was the first time brokers topped the 1,000 mark since August 2022.
Closed sales of condos were also down from year-ago totals (off 30.6%), as were prices (down 5%). The median price on last month’s closed sales of condos was $475,000. Sales prices are up 12% since January.
Good weather is bringing buyers out to tour homes, according to Rebhuhn, and some of them are lured by seller incentives such as pre-inspections and offers of homeowner warranties.
“We’re seeing cash offers on well-priced homes,” he stated.
Brokers and economists say rising interest rates are deterring some buyers.
“Mortgage rates jumped this week, as a buoyant economy has prompted the market to price-in the likelihood of another Federal Reserve rate hike,” said Sam Khater, Freddie Mac’s chief economist. “Although there has been a steady flow of purchase demand around rates in the low to mid six percent range, that demand is likely to weaken as rates approach seven percent.”
“With interest rates moving into the 7% range, we are seeing buyers locking in rates, buying down the rate, and negotiating seller-paid closing costs to take some of the sting out of interest rate volatility,” stated Deely.
According to Freddie Mac, the average rate on a 30-year fixed mortgage jumped to 6.79% from 6.39% the first week of May.
As rates approach the 7% benchmark, Nadia Evangelou, senior economist and director of real estate research for the National Association of REALTORS®, estimates 5.5 million households continue to be priced out of the market compared to a year ago. “Although there are fewer buyers, more than one-third of properties are sold above their list price due to limited inventory, especially of homes that first-time buyers can afford to buy.”
Northwest MLS data show the system-wide sale price to list price ratio on single family homes that sold last month was 100.9%, with nine counties reporting ratios above 100%, meaning buyers paid more than the asking price. For condos, the system-wide selling price to listing price ratio was 100.1%. Eight counties had ratios of 100% or higher.
About Northwest Multiple Listing Service
As the leading resource for the region’s residential real estate industry, NWMLS provides valuable products and services, superior member support, and the most trusted, current residential property and listing information for real estate professionals. NWMLS is a broker-owned, not-for-profit organization with more than 2,400+ member offices and 30,000+ real estate brokers in Washington state and Oregon. NWMLS operates regional service centers throughout its coverage area, providing dedicated support to its members and fostering a robust, cooperative brokerage environment.
NWMLS offers a home listing search and comprehensive broker database at https://www.nwmls.com.
| Single Fam. Homes + Condos | New Listings | Total Active Listings | # Pending Sales | # Closed Sales | Avg. Closed Price | Median Closed Price | This mo. Inventory | Same mo., yr ago |
| King | 3,104 | 2,702 | 2,717 | 2,148 | $1,009,932 | $816,750 | 1.26 | 0.83 |
| Snohomish | 1,170 | 783 | 1,112 | 894 | $782,009 | $720,000 | 0.88 | 0.85 |
| Pierce | 1,327 | 1,033 | 1,331 | 944 | $591,094 | $535,000 | 1.09 | 0.81 |
| Kitsap | 445 | 438 | 418 | 337 | $712,325 | $549,900 | 1.30 | 0.79 |
| Mason | 179 | 190 | 146 | 89 | $459,673 | $400,000 | 2.13 | 1.32 |
| Skagit | 206 | 229 | 168 | 134 | $669,619 | $600,000 | 1.71 | 1.14 |
| Grays Harbor | 173 | 335 | 140 | 114 | $373,770 | $370,400 | 2.94 | 1.77 |
| Lewis | 121 | 180 | 111 | 96 | $417,682 | $391,376 | 1.88 | 1.60 |
| Cowlitz | 128 | 152 | 118 | 90 | $422,760 | $420,075 | 1.69 | 1.31 |
| Grant | 134 | 223 | 120 | 89 | $381,755 | $330,000 | 2.51 | 1.25 |
| Thurston | 480 | 354 | 458 | 329 | $556,487 | $500,000 | 1.08 | 0.78 |
| San Juan | 54 | 126 | 24 | 20 | $1,255,775 | $878,000 | 6.30 | 5.53 |
| Island | 189 | 206 | 161 | 135 | $699,851 | $550,000 | 1.53 | 1.28 |
| Kittitas | 148 | 233 | 83 | 69 | $714,841 | $560,000 | 3.38 | 1.71 |
| Jefferson | 97 | 104 | 57 | 57 | $679,917 | $635,000 | 1.82 | 1.78 |
| Okanogan | 90 | 166 | 50 | 27 | $410,199 | $342,500 | 6.15 | 3.82 |
| Whatcom | 451 | 550 | 337 | 250 | $589,543 | $550,000 | 2.20 | 1.04 |
| Clark | 117 | 96 | 97 | 82 | $560,762 | $514,000 | 1.17 | 0.95 |
| Pacific | 77 | 167 | 55 | 36 | $400,404 | $345,000 | 4.64 | 2.22 |
| Ferry | 12 | 24 | 9 | 7 | $259,271 | $210,000 | 3.43 | 3.86 |
| Clallam | 136 | 161 | 109 | 105 | $519,021 | $496,670 | 1.53 | 1.36 |
| Chelan | 156 | 234 | 105 | 80 | $580,859 | $540,000 | 2.93 | 1.85 |
| Douglas | 52 | 77 | 37 | 35 | $541,634 | $475,000 | 2.20 | 1.05 |
| Adams | 16 | 44 | 15 | 13 | $307,279 | $255,000 | 3.38 | 2.30 |
| Walla Walla | 77 | 104 | 71 | 62 | $470,887 | $426,000 | 1.68 | 1.31 |
| Columbia | 4 | 7 | 7 | 10 | $222,390 | $189,750 | 0.70 | 2.40 |
| Others | 104 | 161 | 64 | 58 | $435,564 | $392,500 | 2.78 | 2.98 |
| Total | 9,247 | 9,079 | 8,120 | 6,310 | $751,807 | $615,000 | 1.44 | 0.97 |
4-county Puget Sound Region Pending Sales (SFH + Condo combined)
(totals include King, Snohomish, Pierce & Kitsap counties)
| Jan | Feb | Mar | Apr | May | Jun | Jul | Aug | Sep | Oct | Nov | Dec | |
| 2004 | 4521 | 6284 | 8073 | 7910 | 7888 | 8186 | 7583 | 7464 | 6984 | 6761 | 6228 | 5195 |
| 2005 | 5426 | 6833 | 8801 | 8420 | 8610 | 8896 | 8207 | 8784 | 7561 | 7157 | 6188 | 4837 |
| 2006 | 5275 | 6032 | 8174 | 7651 | 8411 | 8094 | 7121 | 7692 | 6216 | 6403 | 5292 | 4346 |
| 2007 | 4869 | 6239 | 7192 | 6974 | 7311 | 6876 | 6371 | 5580 | 4153 | 4447 | 3896 | 2975 |
| 2008 | 3291 | 4167 | 4520 | 4624 | 4526 | 4765 | 4580 | 4584 | 4445 | 3346 | 2841 | 2432 |
| 2009 | 3250 | 3407 | 4262 | 5372 | 5498 | 5963 | 5551 | 5764 | 5825 | 5702 | 3829 | 3440 |
| 2010 | 4381 | 5211 | 6821 | 7368 | 4058 | 4239 | 4306 | 4520 | 4350 | 4376 | 3938 | 3474 |
| 2011 | 4272 | 4767 | 6049 | 5732 | 5963 | 5868 | 5657 | 5944 | 5299 | 5384 | 4814 | 4197 |
| 2012 | 4921 | 6069 | 7386 | 7015 | 7295 | 6733 | 6489 | 6341 | 5871 | 6453 | 5188 | 4181 |
| 2013 | 5548 | 6095 | 7400 | 7462 | 7743 | 7374 | 7264 | 6916 | 5951 | 6222 | 5083 | 3957 |
| 2014 | 5406 | 5587 | 7099 | 7325 | 8055 | 7546 | 7169 | 6959 | 6661 | 6469 | 5220 | 4410 |
| 2015 | 5791 | 6541 | 8648 | 8671 | 8620 | 8608 | 8248 | 7792 | 7179 | 6977 | 5703 | 4475 |
| 2016 | 5420 | 6703 | 8130 | 8332 | 9153 | 8869 | 8545 | 8628 | 7729 | 7487 | 6115 | 4727 |
| 2017 | 5710 | 6024 | 7592 | 7621 | 9188 | 9042 | 8514 | 8637 | 7441 | 7740 | 6094 | 4460 |
| 2018 | 5484 | 5725 | 7373 | 7565 | 8742 | 8052 | 7612 | 6893 | 6235 | 6367 | 5328 | 4037 |
| 2019 | 5472 | 4910 | 7588 | 8090 | 8597 | 8231 | 7773 | 7345 | 6896 | 6797 | 5788 | 4183 |
| 2020 | 5352 | 6078 | 6477 | 5066 | 7297 | 8335 | 8817 | 9179 | 8606 | 7934 | 6122 | 4851 |
| 2021 | 5216 | 5600 | 8002 | 7716 | 8674 | 8824 | 8049 | 8586 | 7880 | 7405 | 6022 | 3943 |
| 2022 | 4405 | 5560 | 7312 | 6908 | 7482 | 6031 | 5934 | 6581 | 5208 | 4410 | 3521 | 2778 |
| 2023 | 4111 | 4402 | 4951 | 4966 | 5578 |