Published on:
KIRKLAND, Washington (March 4, 2021) – Housing activity during February remained hot around much of Washington state despite significant accumulation of lowland snow over the Valentine’s Day weekend, according to latest statistical report from the Northwest Multiple Listing Service.
“It’s amazing how close the February numbers are when compared to February 2020, which was, of course, right before our world changed,” said Mike Grady, president and CEO of Coldwell Banker Bain. “Despite our similarly lousy February weather, the data show that the market continues to be hot, with residential inventory very tight and median prices rising by double digits across most of our counties.”
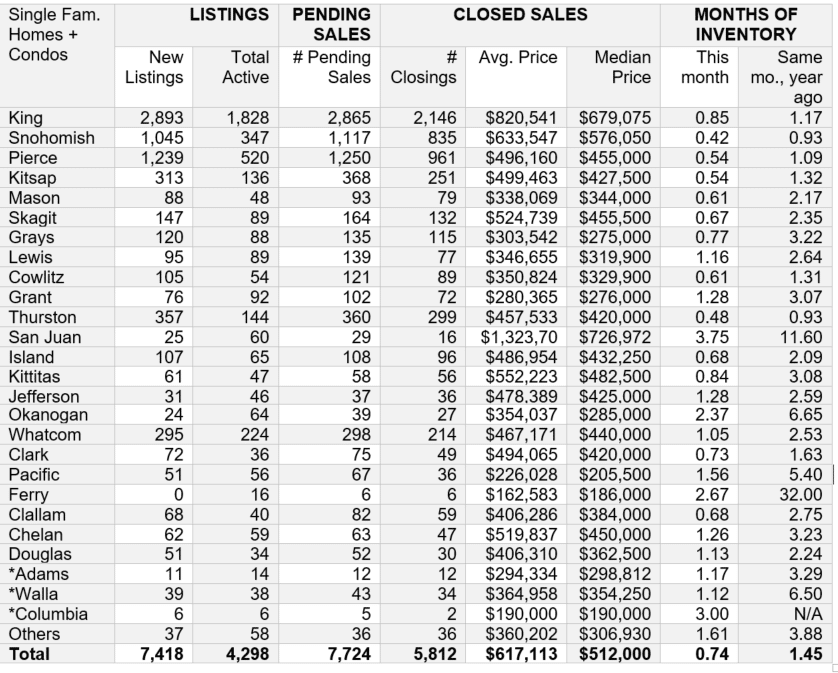
Northwest MLS figures show brokers added a similar number of new listings of single family homes and condos last month (7,418) as a year ago (7,786), for a difference of 368 properties (down 4.7%). For residential units (excluding condos), there was a 6.8% year-over-year (YOY) drop.
Total active listings of single family homes declined nearly 44% from a year ago. The selection of single family homes fell more than 51% while condo inventory rose 7.9%.
“A decline in listing volume this year should not surprise anyone,” remarked James Young, director of the Washington Center for Real Estate Research at the University of Washington.
“We are virtually sold out of unsold inventory everywhere in the Central Puget Sound area except the Seattle city core,” stated J. Lennox Scott, chairman and CEO of John L. Scott Real Estate.
There are only about three weeks of supply (0.74 months) of inventory in the MLS database, which covers 26 counties. For residential only (excluding condos), the shortage is more pronounced at only 0.67 months’ supply.
Condominium shoppers will find somewhat more selection, with inventory up 7.93% from a year ago, and more than a month of supply (1.12 months).
“While pending condominium sales were down slightly in King County (-0.56%), it’s worth noting that several urban neighborhoods, including Queen Anne, Downtown Seattle, and Ballard performed better than expected. That suggests to me that there may not be the mass exodus from the core urban areas that many have been predicting,” commented Windermere Chief Economist Matthew Gardner.
Nearly six of every 10 pending sales of condos took place in King County last month, according to the Northwest MLS report. Pending activity nearly match the year ago totals for that county (716 versus 720). Pending sales (mutually accepted offers) were up sharply in several Seattle neighborhoods, including Queen Anne (48.8%), West Seattle (42.1%), and Ballard/Green Lake (32.5%). Even the Downtown/Belltown area registered an uptick (4.8%).
Gardner said it was particularly interesting to see the jump in pending sales in the Puget Sound region from January and February. For the tri-county area encompassing King, Pierce and Snohomish counties, the MLS report shows there were 4,896 pending sales in January and 5,232 sales in February for a month-to-month gain of 6.9%.
“This tells me that neither the snowstorm that hit the region nor the jump in mortgage rates deterred buyers who were still out in force last month,” said Gardner.
Lennox Scott also noted the slight increase in mortgage rates, saying it “created a mini power surge of sales activity intensity.”
Freddie Mac reported an average rate of 3.02% for a 30-year fixed-rate mortgage for the week ending March 4. That’s up five basis points from the previous week, and the first time since July 2020 that the benchmark mortgage rate climbed above 3%.
Despite rates edging up and inclement weather during much of February, eight counties in the Northwest MLS report showed year-over-year gains in pending sales: Adams, Douglas, Grant, Kitsap, Lewis, Pacific, San Juan, and Walla Walla.
System-wide, there were 7,724 pending sales in February, a YOY drop of 7.5%, but compared to January when brokers reported 7,394 sales, the pending volume increased 4.5%.
Within King County, Gardner noted suburban markets such as Renton, Burien, “and interestingly, West Seattle (given the bridge issue),” continued to see significant sales activity in February, “but so too did more urban markets like Madison Park/Capitol Hill, Ballard/Green Lake, Queen Anne, and Magnolia, all of which reported sizable increases in home sales.”
Of the 30 neighborhood areas the MLS tracks within King County, thirteen of them showed year-over-year increases in pending sales.
Northwest MLS director John Deely, executive vice president of operations at Coldwell Banker Bain, said, “Like last year, before we knew what was just around the corner, buyer demand is high. There continues to be opportunities for buyers seeking condos, and median prices are more stable, so that’s also good news for buyers.”
On the residential side (excluding condos), Deely said he is hearing more and more about multiple offer situations. “Our brokers are working hard to help prepare buyers both emotionally and financially for the realities they face, and to help position them as the winning purchaser. With things opening up, and open house restrictions eased to allow more people at one time, brokers are also spending a good amount of time preparing their sellers to get comfortable with having people in their homes and to safely facilitate viewings, as well as managing and analyzing all the offers.”
Northwest MLS member-brokers reported 5,812 closed sales during February for a 10.4% increase over the year-ago total of 5,265 closings. The median price on last month’s completed sales jumped more than 15% from a year ago, increasing from $445,000 to $512,000. Twenty of the 26 counties in the report showed double-digit YOY price gains.
“Continuing low interest rates, jobs, and lifestyle changes are driving the real estate market,” said Dean Rebhuhn, owner of Village Homes and Properties, who also noted the uptick in multiple offers. “Prepared, aggressive buyers are winning the competition for homes. Smart buyers are making substantial offers to sellers prior to the offer review date, and sellers are considering them.”
Scott noted March historically marks the beginning of an eight-month primetime real estate market. “After an intense winter in the local real estate market, more new resale listings are on the horizon,” he remarked, adding, “The intensity we’re seeing should come down slightly as more available homes enter the market, but we have to play catch-up with pent-up buyer demand first.”
Grady expressed similar views. “The positive, optimistic mood is unmistakable, and we expect that to continue as vaccines roll out, things continue opening, and projects like the Northgate Link Light Rail station are completed, allowing people to move further out as they can more efficiently manage their commutes. We are bullish on the market this spring, and frankly, for the rest of the year. Bring on the Roaring ’20s, version 2.0,” he exclaimed.”
About Northwest Multiple Listing Service
As the leading resource for the region’s residential real estate industry, NWMLS provides valuable products and services, superior member support, and the most trusted, current residential property and listing information for real estate professionals. NWMLS is a broker-owned, not-for-profit organization with more than 2,400+ member offices and 30,000+ real estate brokers in Washington state and Oregon. NWMLS operates regional service centers throughout its coverage area, providing dedicated support to its members and fostering a robust, cooperative brokerage environment.
NWMLS offers a home listing search and comprehensive broker database at https://www.nwmls.com.
*Adams, Walla Walla and Columbia counties are added as separate rows this month; previously, statistics for these counties were included in the row for “Others/Out of area.”
4-county Puget Sound Region Pending Sales (SFH + Condo combined)
(totals include King, Snohomish, Pierce & Kitsap counties)
|
Jan |
Feb |
Mar |
Apr |
May |
Jun |
Jul |
Aug |
Sep |
Oct |
Nov |
Dec | |
|
2003 |
4746 |
5290 |
6889 |
6837 |
7148 |
7202 |
7673 |
7135 |
6698 |
6552 |
4904 |
4454 |
|
2004 |
4521 |
6284 |
8073 |
7910 |
7888 |
8186 |
7583 |
7464 |
6984 |
6761 |
6228 |
5195 |
|
2005 |
5426 |
6833 |
8801 |
8420 |
8610 |
8896 |
8207 |
8784 |
7561 |
7157 |
6188 |
4837 |
|
2006 |
5275 |
6032 |
8174 |
7651 |
8411 |
8094 |
7121 |
7692 |
6216 |
6403 |
5292 |
4346 |
|
2007 |
4869 |
6239 |
7192 |
6974 |
7311 |
6876 |
6371 |
5580 |
4153 |
4447 |
3896 |
2975 |
|
2008 |
3291 |
4167 |
4520 |
4624 |
4526 |
4765 |
4580 |
4584 |
4445 |
3346 |
2841 |
2432 |
|
2009 |
3250 |
3407 |
4262 |
5372 |
5498 |
5963 |
5551 |
5764 |
5825 |
5702 |
3829 |
3440 |
|
2010 |
4381 |
5211 |
6821 |
7368 |
4058 |
4239 |
4306 |
4520 |
4350 |
4376 |
3938 |
3474 |
|
2011 |
4272 |
4767 |
6049 |
5732 |
5963 |
5868 |
5657 |
5944 |
5299 |
5384 |
4814 |
4197 |
|
2012 |
4921 |
6069 |
7386 |
7015 |
7295 |
6733 |
6489 |
6341 |
5871 |
6453 |
5188 |
4181 |
|
2013 |
5548 |
6095 |
7400 |
7462 |
7743 |
7374 |
7264 |
6916 |
5951 |
6222 |
5083 |
3957 |
|
2014 |
5406 |
5587 |
7099 |
7325 |
8055 |
7546 |
7169 |
6959 |
6661 |
6469 |
5220 |
4410 |
|
2015 |
5791 |
6541 |
8648 |
8671 |
8620 |
8608 |
8248 |
7792 |
7179 |
6977 |
5703 |
4475 |
|
2016 |
5420 |
6703 |
8130 |
8332 |
9153 |
8869 |
8545 |
8628 |
7729 |
7487 |
6115 |
4727 |
|
2017 |
5710 |
6024 |
7592 |
7621 |
9188 |
9042 |
8514 |
8637 |
7441 |
7740 |
6094 |
4460 |
|
2018 |
5484 |
5725 |
7373 |
7565 |
8742 |
8052 |
7612 |
6893 |
6235 |
6367 |
5328 |
4037 |
|
2019 |
5472 |
4910 |
7588 |
8090 |
8597 |
8231 |
7773 |
7345 |
6896 |
6797 |
5788 |
4183 |
|
2020 |
5352 |
6078 |
6477 |
5066 |
7297 |
8335 |
8817 |
9179 |
8606 |
7934 |
6122 |
4851 |
|
2021 |
5216 |
5600 |
|
|
|
|
|
|
|
|
|
|
Other resources: